
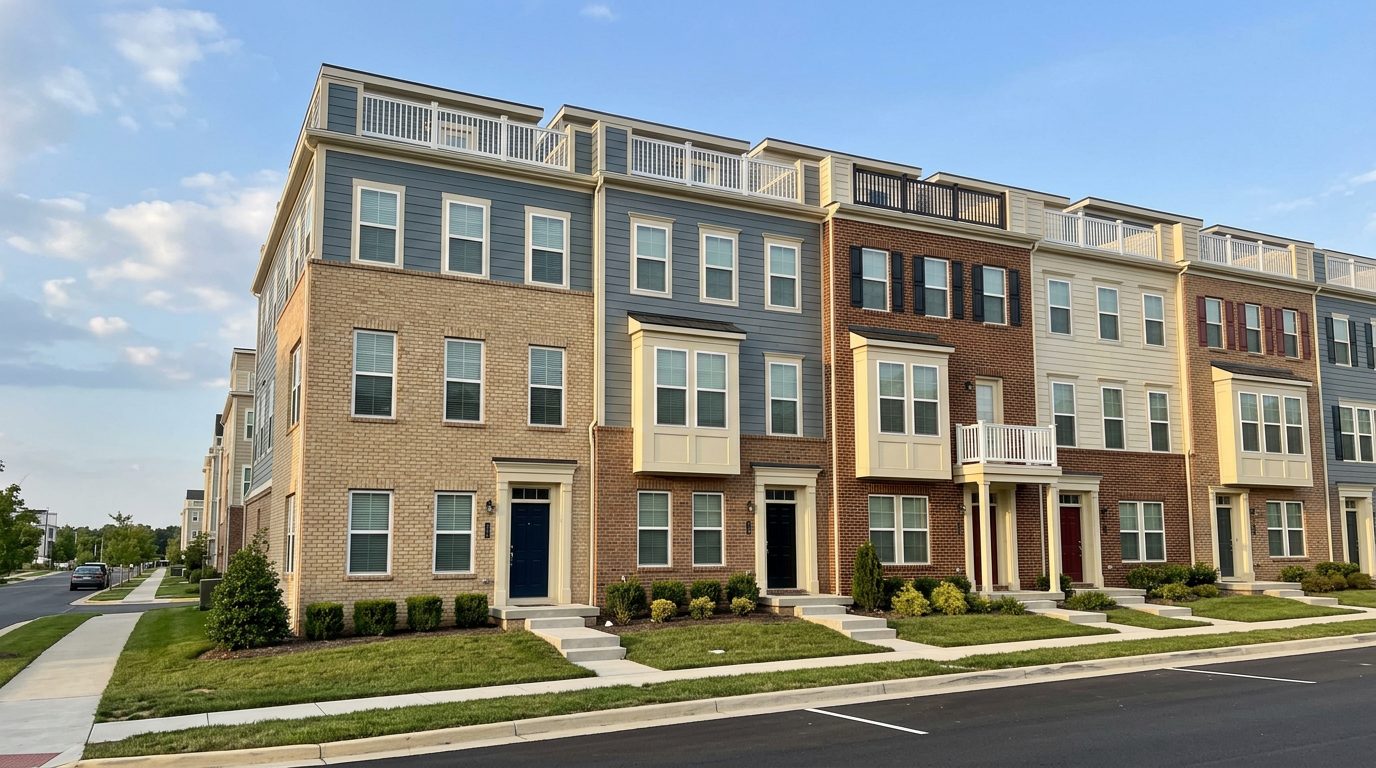

2020
$675,000median house price, sales from January 1 to September 30, 2020
- Loan, after 20% down
- $540,000
- Average 30-year rate
- 3.11%
- Principal and interest
- $2,309 a month
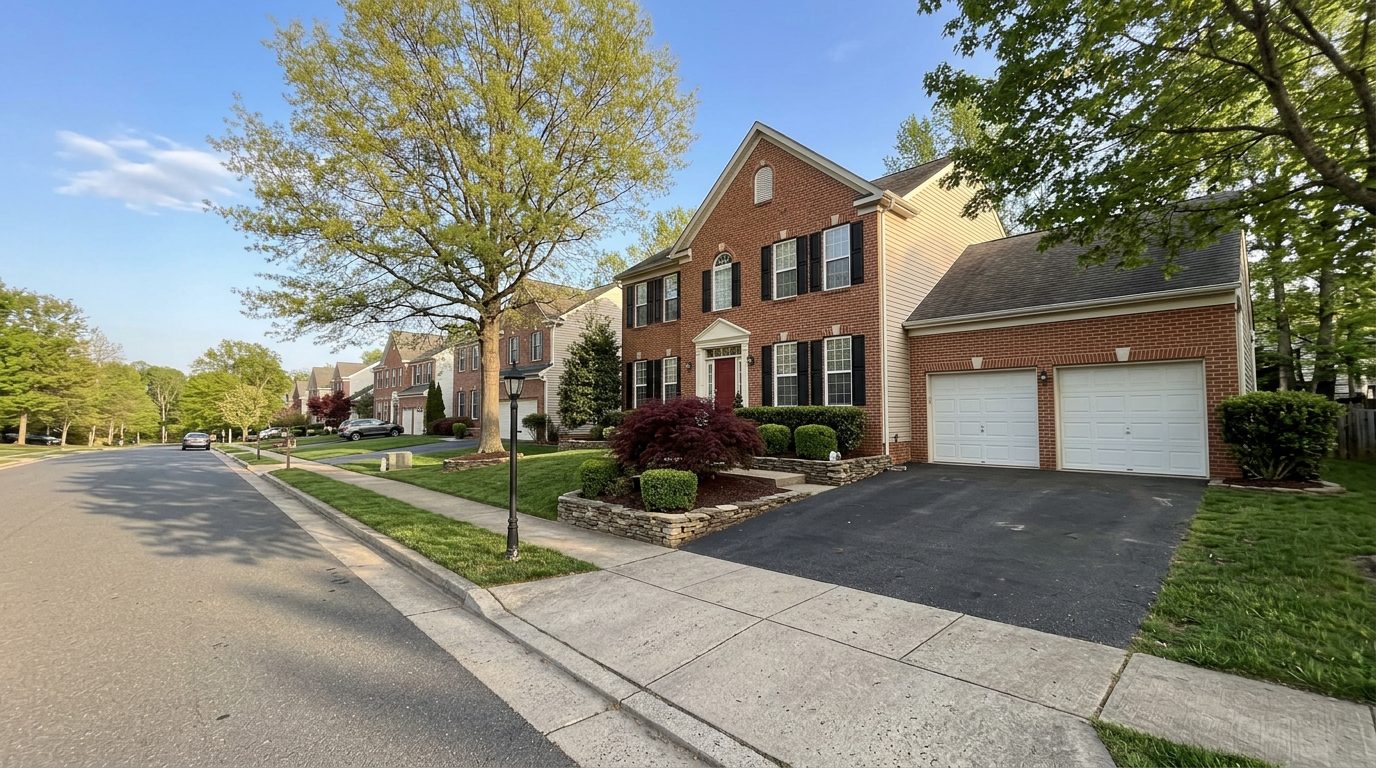
191,988 Bright MLS sales, the same January-to-September stretch of every year from 2019 to 2026. What cheap money did to prices and payments, and why prices have not come back down.
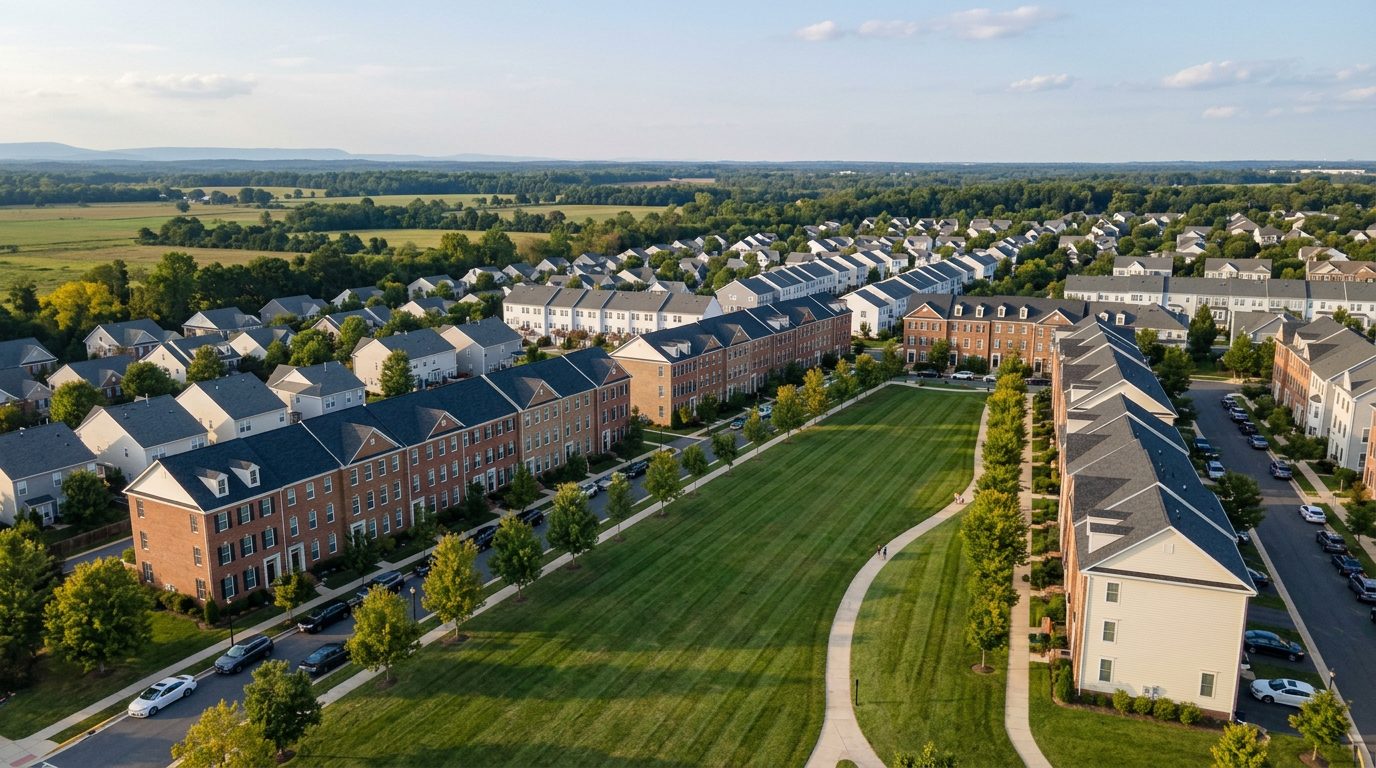
Fairfax County: median house price up 45% since 2019· Laurel Hill, Lorton, Fairfax County
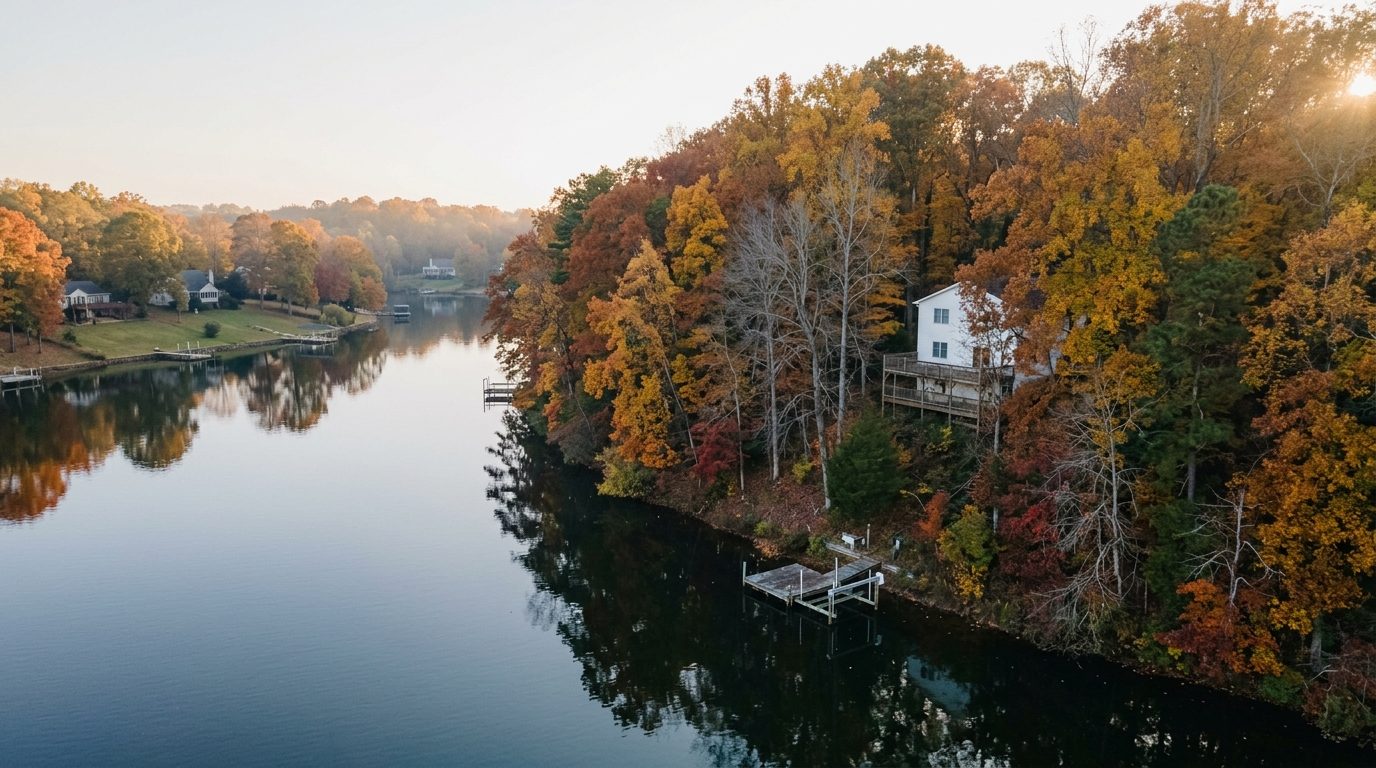
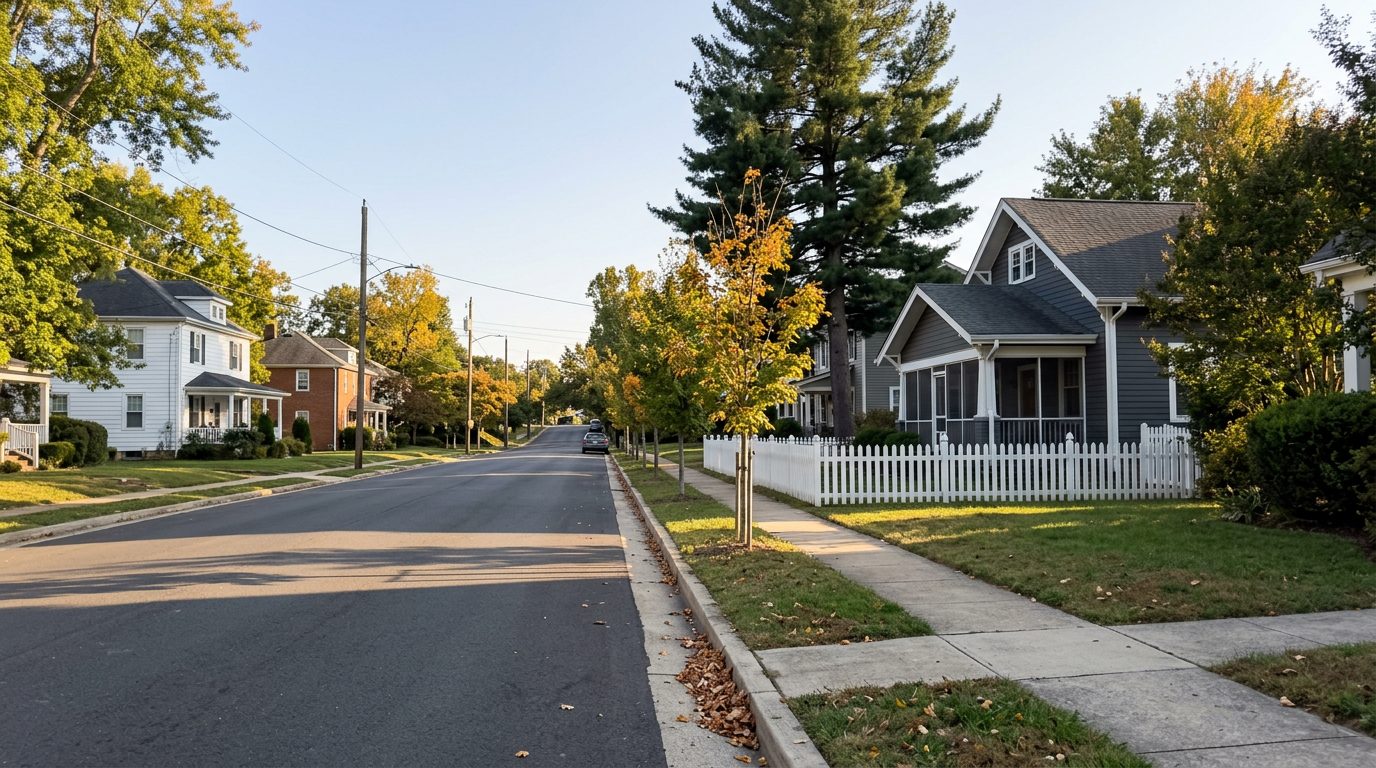
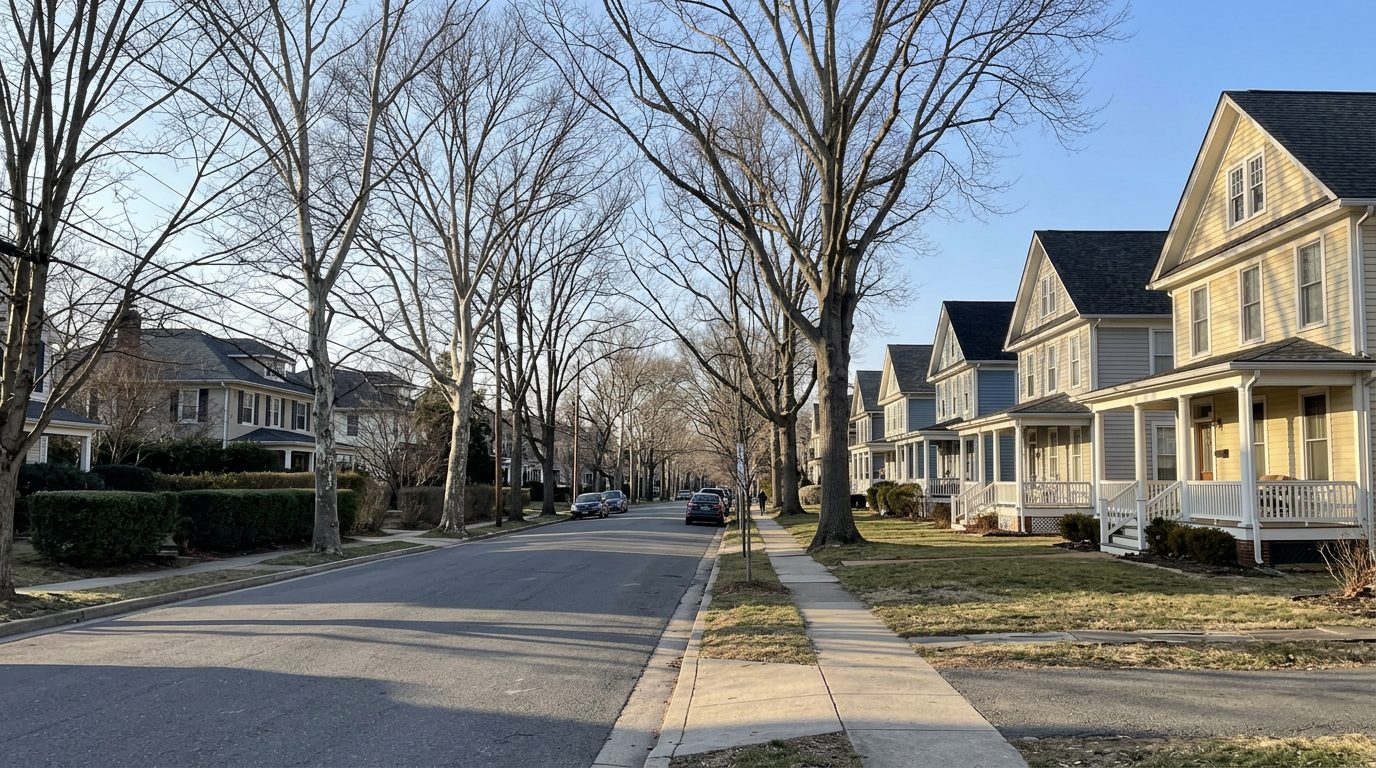
Price changes: sales from January 1 to September 30, 2019 and 2026. Pictures: artist’s renderings of real places.
Published October 11, 2026Bright MLS closed sales, 2019 to 2026About a 10-minute read
Quick answer
The median Northern Virginia house sold for $950,000 from January to September 2026, up 41% from $675,000 in the same months of 2020 and 51% from $630,000 in 2019. Every county rose, from 41% in Arlington to 64% in Loudoun County since 2019. Cheap money started it: the 30-year mortgage rate averaged 3.11% in 2020 and 2.96% in 2021, and has not been under 4% since March 2022.4 The monthly payment more than doubled, from $2,309 in 2020 to $4,769 in 2026 (principal and interest on the median house, 20% down). Prices have not come back down because owners with low rates are not selling: 39% fewer homes sold from January to September 2026 than in the same months of 2021, and 44.7% of houses still sold for more than the asking price.
Houses and townhouses sold from January 1 to September 30 of each year (Bright MLS); mortgage rates from Freddie Mac and FHFA
191,988 closed sales of houses and townhouses from January 1, 2019 to October 2, 2026 in Fairfax, Loudoun, Prince William and Arlington counties and the cities of Alexandria, Fairfax, Falls Church, Manassas and Manassas Park. Condos are not included. Each year is counted over the same months, January 1 to September 30, so 2026 compares fairly with the years before it.
County by county
The median house price in each county, counted over the same nine months of every year, January to September, so 2026 lines up with the years before it. Loudoun County gained the most in percent. Arlington and the City of Alexandria are still the most expensive.
Median house price by county
Detached houses, sales from January 1 to September 30 of each year, 2019 to 2026
Dashed line: all of Northern Virginia. Fairfax includes the cities of Fairfax and Falls Church; Prince William includes Manassas and Manassas Park.
| Area | 2019 | 2020 | 2021 | 2022 | 2023 | 2024 | 2025 | 2026 | Since 2019 | Since 2020 |
|---|---|---|---|---|---|---|---|---|---|---|
| Northern Virginiaall nine jurisdictions | $630,000 | $675,000 | $760,000 | $825,000 | $834,750 | $900,000 | $927,500 | $950,000 | +51% | +41% |
| Fairfax Countywith Fairfax City and Falls Church | $685,000 | $735,000 | $815,000 | $874,000 | $880,000 | $950,000 | $975,000 | $991,269 | +45% | +35% |
| Loudoun County | $660,000 | $708,198 | $819,950 | $905,000 | $925,000 | $998,231 | $1,059,990 | $1,080,000 | +64% | +52% |
| Prince William Countywith Manassas and Manassas Park | $459,692 | $500,500 | $575,000 | $630,000 | $635,000 | $680,000 | $695,000 | $716,000 | +56% | +43% |
| Arlington | $955,000 | $1,000,000 | $1,081,000 | $1,175,000 | $1,220,000 | $1,290,250 | $1,325,000 | $1,350,000 | +41% | +35% |
| City of Alexandria | $864,000 | $935,000 | $1,005,000 | $1,105,000 | $1,075,000 | $1,164,750 | $1,200,000 | $1,286,000 | +49% | +38% |
Medians: the middle sale of each year, half sold for more and half for less. The City of Alexandria had the fewest house sales, 244 from January to September 2026, so its yearly figure moves more; it dipped in 2023 and rose again after.
| Median townhouse price | Houses and townhouses sold | |||||||
|---|---|---|---|---|---|---|---|---|
| Area | 2019 | 2020 | 2026 | Since 2019 | 2019 | 2021 | 2026 | 2026 vs 2021 |
| Northern Virginia | $433,183 | $465,000 | $650,000 | +50% | 22,106 | 26,059 | 15,874 | -39% |
| Fairfax County | $460,000 | $496,000 | $655,000 | +42% | 10,128 | 11,769 | 7,548 | -36% |
| Loudoun County | $455,000 | $490,000 | $700,000 | +54% | 4,475 | 5,435 | 3,061 | -44% |
| Prince William County | $325,000 | $345,000 | $520,000 | +60% | 5,720 | 6,669 | 3,768 | -43% |
| Arlington | $790,000 | $873,650 | $1,050,000 | +33% | 951 | 1,161 | 848 | -27% |
| City of Alexandria | $697,450 | $720,000 | $915,000 | +31% | 832 | 1,025 | 649 | -37% |
Since 2020. From the 2020 months to the 2026 months, Loudoun County’s median house price rose the most, 52%, from $708,198 to $1,080,000. Prince William County followed at 43%, the City of Alexandria at 38%, and Arlington and Fairfax County at 35% each.
Townhouses. Across Northern Virginia, the median townhouse price rose about as fast as the median house, from $433,183 in 2019 to $650,000 in 2026, up 50%. In Fairfax and Arlington the 2026 townhouse figure was a little below 2025’s, the first year-to-year dip in either since 2019.
Not just bigger houses. The median price per finished square foot above ground, for houses, rose from $276 in 2019 to $425 in 2026, up 54%: the same space costs that much more.
The cheap-money years
Freddie Mac’s weekly survey of 30-year fixed rates began in 1971. Until July 2020 it had never shown a rate under 3%. Then it did, 24 weeks in 2020 and 31 in 2021, and the yearly averages for 2020 and 2021 are the lowest in the survey’s history.4
30-year mortgage rate, yearly average
Freddie Mac, average of each year’s weekly rates; 2026: the weeks of January 8 to October 14
Dark bars: 2020 and 2021, the lowest yearly averages in the survey’s history.
The milestones
When the pandemic hit, the Fed cut its benchmark rate to the floor and started buying mortgage-backed securities, the bonds made of home loans. Buying them adds demand for mortgages, which pushes mortgage rates down. Then, from late 2021, it wound the buying down.5,6
The federal funds target cut to 0 to 1/4 percent, effective March 16, and a plan to buy at least $200 billion of agency mortgage-backed securities and at least $500 billion of Treasury securities.5
The Fed said it would keep buying Treasury and agency mortgage securities in whatever amounts were needed to keep markets working.5
The steady pace of the Fed’s agency mortgage-backed securities purchases.6
Monthly purchases cut back by $5 billion for mortgage securities and $10 billion for Treasury securities.5
Net purchases to end in early March 2022.5
From June 1, 2022, mortgage securities that paid down were replaced only above a cap of $17.5 billion a month, rising to $35 billion after three months.5
Refinance loans made in the United States
Millions of loans, from the CFPB’s count of home-loan records7
2021 and 2022 are the CFPB’s rounded figures (about 8.3 million and about 2.2 million).
Owners did the math. Refinance loans went from 3.4 million in 2019 to 8.4 million in 2020 and about 8.3 million in 2021: more than 16 million refinance loans in two years. That counts loans, not owners, since some refinanced twice.7
A fixed-rate loan keeps its rate until the owner sells the house or refinances again. Millions of owners now hold rates near 3%, and that is what the rest of this story turns on. When rates rose in 2022, refinancing fell to about 2.2 million loans.7
What the payment did
Prices and rates rose together. Here is the monthly principal and interest on the median Northern Virginia house of each year, with 20% down and a 30-year fixed loan at that year’s average rate.
Monthly payment, year by year
Principal and interest on that year’s median house price (sales from January 1 to September 30), 20% down, 30-year fixed at the year’s average rate (shown under each year)4
Two things at once. From 2020 to 2026 the median house price rose 41% and the average rate more than doubled, from 3.11% to 6.43%. Had the rate stayed at 3.11%, the 2026 payment would be $3,249 a month. The rest of the rise, $1,520 a month, is the rate.
At the October 1 rate. At 7.28%, the rate of the week of October 1, 2026, the same $760,000 loan would cost $5,200 a month.4
Incomes did not keep up. Median household income rose about 20% in Fairfax County and 17% in Loudoun from 2019 to 2024 (Census).10 Over the same full years, the median house price rose 39% in Fairfax and 52% in Loudoun.
Principal and interest only. Property tax, insurance and any HOA fee come on top: the buying power calculator adds them for your own numbers.
Why prices are not crashing
A price crash needs owners who must sell. Northern Virginia has the opposite: owners holding loans at 3% or 4% who would pay far more on their next one. Fewer of them list, fewer homes sell, and buyers still compete for the ones that do.
In the first quarter of 2026, 22.9% of Virginia mortgages carried a rate under 3% and 53.5% a rate under 4%.8 A new 30-year loan cost 7.28% in the week of October 1, 2026.4 Researchers at the Federal Housing Finance Agency found that for every percentage point the market rate sits above an owner’s own rate, the chance that the owner sells falls by 18.1%. Across the country they estimate this lock-in cost about 1.72 million home sales from the second quarter of 2022 to the second quarter of 2024, and left prices about 7% higher than they would otherwise have been.9 The wider question of a crash has its own study: Will Northern Virginia home prices crash?
Homes put up for sale, and homes sold
Houses and townhouses, January 1 to September 30 of each year: new listings entered (all statuses) and closed sales
New listings enteredHomes sold
New listings count every listing entered, whatever became of it, so a home withdrawn and put back up can count twice.
Homes sold in each full year
Houses and townhouses, January 1 to December 31, 2019 to 2025; the striped bar is 2026 from January 1 to September 30 only
Full year2026, January to September
The dark bar is 2021, the busiest year: 33,749 sales.
Fewer listings, fewer sales. From January to September 2026, 22,110 homes were put up for sale, 25.8% fewer than the 29,792 of the same months in 2019 and 30.3% fewer than 2021’s 31,742. The low point was 2023, 38.0% below 2019. New listings have risen every year since, but not back to 2019. Homes sold followed: 15,874 from January to September 2026, 28% fewer than 2019’s 22,106 and 39% fewer than 2021’s 26,059.
Prices rose anyway. Over those same years, the median house price rose 51%, and it went up in every one of them.
Houses sold for more than the asking price
Share of detached houses that sold above their list price, sales from January 1 to September 30 of each year
With so few homes coming up, bidding never stopped. From January to September 2026, 44.7% of Northern Virginia houses sold for more than the asking price, against 31.4% in the same months of 2019. The share peaked at 62.1% in 2021 and has eased since, but it is still higher than before cheap money.
Homes also sell fast: the median house sold in 6 days on the market in 2026, against 11 in 2019. For townhouses the share was 41.3% in 2026, about where it was in 2019 (40.6%).
How rare it was
Rates under 3% were once in a blue moon. They came once in the survey’s history, and it took a pandemic emergency and the Fed’s bond buying to bring them.
Freddie Mac’s weekly survey, April 1971 to October 2026
Every week of the survey sits on this line, from April 2, 1971 to October 1, 2026. The red band runs from July 16, 2020, the first week under 3%, to November 10, 2021, the last. The gold tick is November 21, 2012, the lowest week before 2020, at 3.31%.4
What the record shows. In the 49 years of Freddie Mac’s survey before July 2020, the 30-year rate never went below 3%; the lowest week was 3.31% in November 2012. The rate fell under 3% only after the Fed had cut its benchmark rate to 0 to 1/4 percent and committed to buying at least $200 billion of mortgage bonds, then as much as was needed. It stayed there for 55 weeks, the last in November 2021.4,5
What it does not show. Whether or when rates return there. Nobody can promise that, and this page does not try. What the record does show is how rare those weeks were, and why so many owners are holding on to the loans they got in them.
What it means now
If you are buying
If you are selling
How it was done
Every year is counted from January 1 to September 30, so 2026, with sales through early October, compares fairly with the years before it.
Questions
The median house price rose 41%, from $675,000 to $950,000, comparing sales from January to September 2020 with the same months of 2026. Since 2019 it rose 51%. The median townhouse price rose about as much since 2020, 40%, from $465,000 to $650,000.
Because few owners have to sell, and fewer choose to. In the first quarter of 2026, 53.5% of Virginia mortgages carried a rate under 4%, while a new 30-year loan cost 7.28% in the week of October 1, 2026. So fewer homes come up for sale: 22,110 new listings were entered from January to September 2026, against 29,792 in the same months of 2019. Buyers still compete for them: 44.7% of houses sold for more than the asking price in those months of 2026.
No one can promise that. In Freddie Mac’s weekly survey, which goes back to 1971, the 30-year rate was under 3% for 55 weeks, all of them in 2020 and 2021, during a pandemic emergency when the Fed held its benchmark rate at 0 to 1/4 percent and bought mortgage bonds. The rate has not been under 4% since the week of March 10, 2022, and it was 7.28% in the week of October 1, 2026.
Loudoun County. Its median house price rose 52%, from $708,198 to $1,080,000, comparing sales from January to September 2020 and 2026. Prince William County followed at 43%, the City of Alexandria at 38%, and Arlington and Fairfax County at 35% each. Measured from 2019, Loudoun County also rose the most, 64%.
About twice as high. With 20% down and a 30-year fixed loan, principal and interest came to $2,309 a month in 2020, on a $675,000 median house at that year’s 3.11% average rate. In 2026 it is $4,769 a month, on a $950,000 median house at 6.43%. Taxes and insurance come on top.
Yes. From January to September 2026, 22,110 houses and townhouses were put up for sale in Bright MLS, 25.8% fewer than in the same months of 2019 (29,792). The low point was 2023, with 18,472. Homes sold fell too: 15,874 in those months of 2026, against 22,106 in 2019.
Your next step
Tell me about your street, or the home you want. I answer in English or Arabic, with real numbers, not a pitch.
دليل شمال فرجينيا · دراسة السوق
بلغ السعر الوسطي للبيت المستقل في شمال فرجينيا $950,000 في المبيعات المنجزة من 1 يناير إلى 30 سبتمبر 2026، مقابل $675,000 في الأشهر نفسها من عام 2020، أي بزيادة 41%، و$630,000 في عام 2019، أي بزيادة 51%. وارتفعت الأسعار في كل المقاطعات منذ 2019، من 41% في أرلنغتون إلى 64% في لاودن.
بدأ ذلك مع المال الرخيص: انخفض متوسط الفائدة على القرض العقاري الثابت لثلاثين عاماً إلى 3.11% في 2020 و2.96% في 2021، وهما أدنى متوسطين سنويين في مسح «فريدي ماك» الذي بدأ عام 1971. ولم تنزل الفائدة تحت 3% إلا 55 أسبوعاً في تاريخ المسح كله، وكلها في 2020 و2021. ولا يستطيع أحد أن يجزم إن كانت ستعود إلى ذلك المستوى أو متى.
وتضاعف القسط الشهري من $2,309 في 2020 إلى $4,769 في 2026، وهو أصل القرض والفائدة على البيت ذي السعر الوسطي، مع دفعة أولى بنسبة 20%.
فلماذا لا تنخفض الأسعار؟ لأن 53.5% من القروض العقارية في فرجينيا بفائدة أقل من 4% (الربع الأول من 2026)، فلا يرغب كثير من أصحابها في البيع. فقد بلغ عدد المنازل التي عُرضت للبيع من يناير إلى سبتمبر 2026 ما مجموعه 22,110، أي أقل بنسبة 25.8% من الأشهر نفسها في 2019. وبلغ عدد المنازل المبيعة 15,874 مقابل 26,059 في الأشهر نفسها من 2021.
وكيلك العقاري الموثوق في شمال فرجينيا.
Keep exploring
Every town compared.
Open the guide County guideEvery town compared.
Open the guide County guideEvery town compared.
Open the guide County guidePrices by zip code and Metro stop.
Open the guide City guideOld Town, Del Ray and the rest.
Open the guide DataWhat waiting cost, from 1975 on.
See the history