

AM Real Estate Ahmed MakkiyahNorthern Virginia Guide
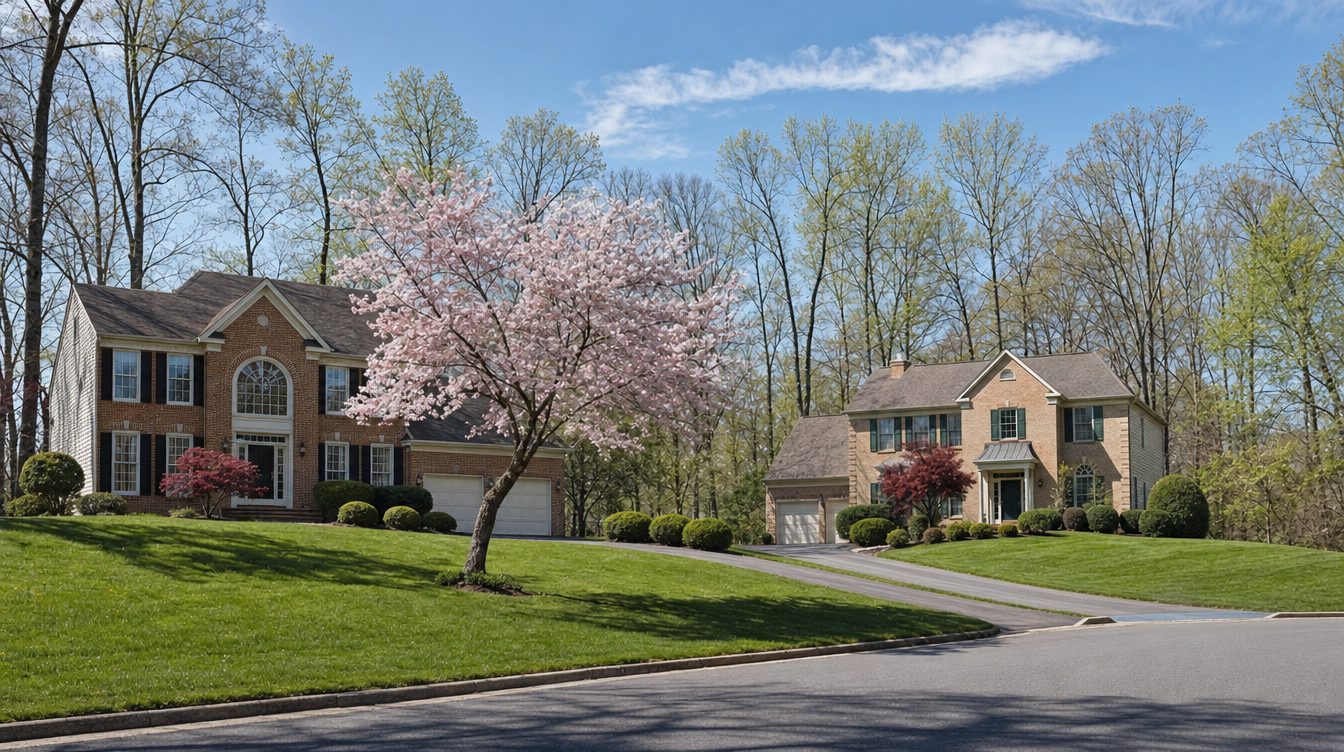
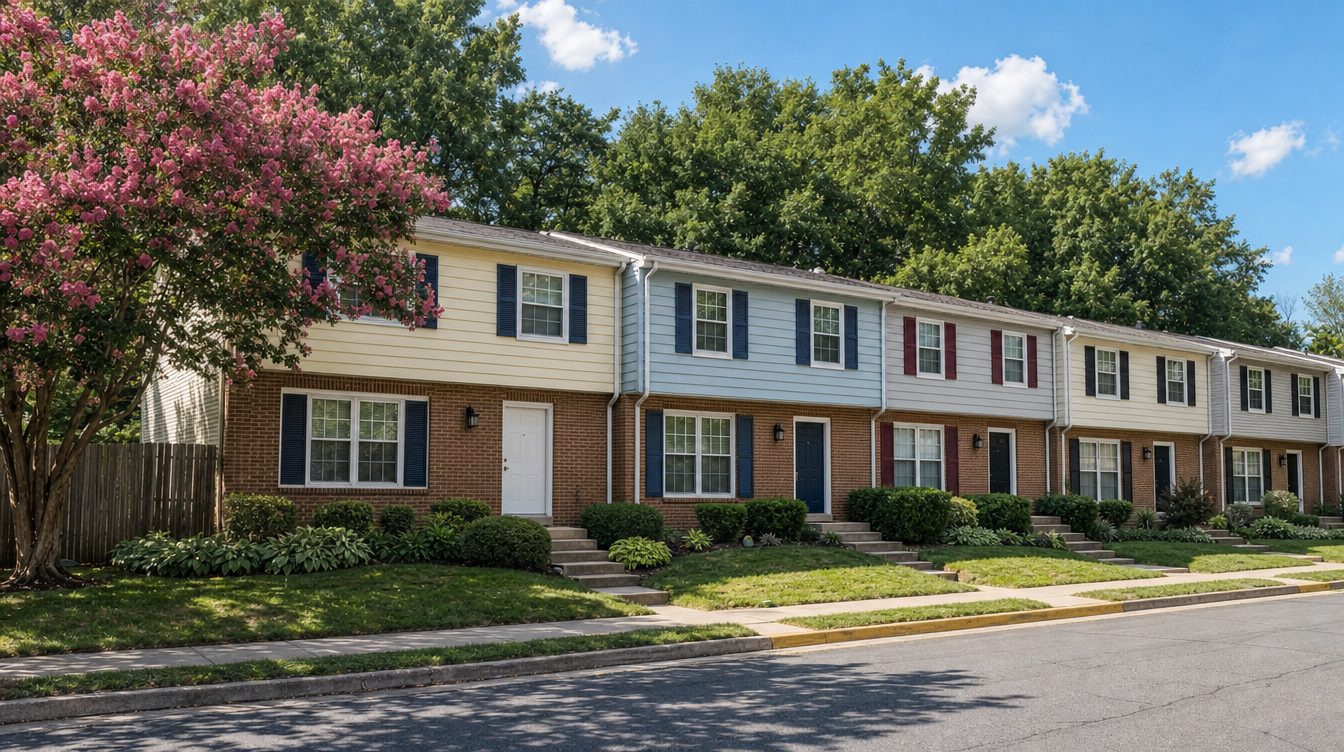
Brick-front colonials on Crosspointe Drive in Fairfax Station in early spring, a pink dogwood in bloom on the lawn
Market study

Spring rush or winter deal?The best time to buy or sell a house in Northern Virginia

Every listing from three years of Bright MLS records, month by month, by price and by county. And one REALTOR’s rule of thumb, put to the test.

March: 58% of listings sold over asking· Crosspointe Drive, Fairfax Station

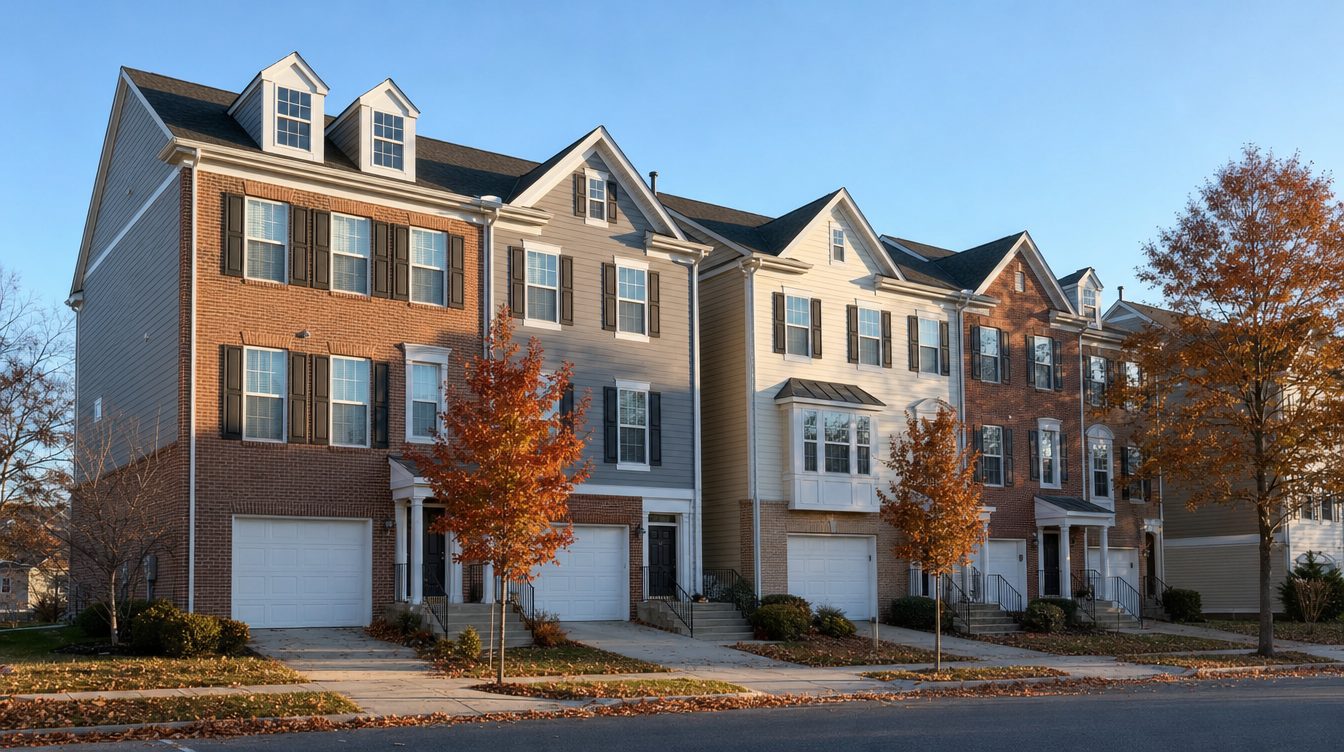
Month figures: homes listed 2023 to 2025. Pictures are artist’s renderings of real streets.

Published October 8, 202670,875 listings, Bright MLS, 2023 to 2025About a 10-minute read

Quick answer

List in February or March. Of the Northern Virginia homes listed in those months from 2023 to 2025, 57% to 58% sold over the original asking price, in a median of 5 days, and only about 12% had to cut the price. Summer listings, June to August, did worse: 38% to 46% sold over asking, 20% to 24% cut the price and about one in five never sold. Buyers get the most room to negotiate on homes listed from August to October. Homes of $2 million and up are slow in every season, but they also did best when listed from January to March.

The selling year in six numbers

Homes listed from January 1, 2023 to December 31, 2025, Bright MLS

58%of homes listed in March sold over asking, the best month of the year
5 daysmedian time to sell for February and March listings
24%of August listings cut the price, against 12% in February and March
1 in 5summer and fall listings never sold: they expired, were withdrawn or were canceled
5%more per square foot for houses that closed in May than in January (townhouses: 6%)
56 daysfrom listing to closing for three in four June listings: about 8 weeks to plan around

70,875 houses and townhouses listed in Fairfax, Loudoun, Prince William and Arlington counties and the cities of Alexandria, Fairfax, Falls Church, Manassas and Manassas Park: 58,570 sold and 12,305 did not. Condos are not included.

The verdict

Late winter beats summer, three years running.

The usual advice is to sell in spring and buy in winter. Northern Virginia’s own records say the best weeks to list start earlier than most sellers think, and the pattern held in 2023, 2024 and 2025 alike.

If you are selling

List from February to early April.

Those listings sold over asking most often, in the shortest time and with among the fewest price cuts. From May on, more homes compete for the same buyers, and by August 24% of listings were cutting the price, about twice the share in February and March.

If you are buying

Shop August to October.

Homes listed in those months had the most price cuts (23% to 24%), and only 35% to 38% sold over asking. Winter is cheaper per square foot, by about 3% for January closings, but with the fewest homes to choose from.

If your home is $2M or more

Still list early in the year.

The top of the market is slow in every season: a median 22 to 27 days, and 44% to 50% of listings never sold. But January to March was still its best window, at 98.1% of the original asking price against 96.4% for July to September.

Month by month

The listing clock: March is the best month to list.

Each hour on the clock is a month. The color shows how many homes listed that month sold for more than their original asking price: red for bidding wars, blue for a buyer’s month.

The listing clock: each hour is a month. The share of homes that sold over asking, by the month they were listed, 2023 to 2025: January 50%, February 57%, March 58%, April 56%, May 49%, June 46%, July 42%, August 38%, September 37%, October 35%, November 36%, December 36%. The hand points at March, the best month to list.50%JAN57%FEB58%MAR56%APR49%MAY46%JUN42%JUL38%AUG37%SEP35%OCT36%NOV36%DECTHE LISTING CLOCKMARBEST MONTHTO LIST
35%58% sold over asking
Every house and townhouse listed in Northern Virginia from January 1, 2023 to December 31, 2025, grouped by the month it was listed.
Every home listed in each month, 2023 to 2025
Month listedHomes listedSold over askingMedian days to sellCut the priceNever sold
January4,02150%612%15%
February4,87257%512%14%
March7,28258%513%14%
April8,02956%615%15%
May8,60249%619%16%
June7,40446%720%19%
July6,52442%722%19%
August5,81638%824%21%
September6,51137%924%20%
October5,70135%1023%20%
November3,70436%918%18%
December2,40936%714%17%

Why not May? May brings more new listings than any other month, 12.1% of the year’s, so a seller competes with the most other homes. The buyers are there too, but they have more to choose from. In February and March fewer homes come on the market, 6.9% and 10.3% of the year’s new listings, and more than half of them sold over asking.

The slow stretch. August to October listings did worst: the most price cuts, the most homes that never sold, and among the fewest sales over asking. About one in five summer and fall listings expired, was withdrawn or was canceled.

By price

Every price range did best listed January to March.

Under $1 million, the early-year advantage is strongest: more than half of those homes sold over asking. Above $1.5 million, the market is slower in every season, and the season matters less than the price.

Sold over asking, by original asking price and the months a home was listed. Under each: median days to sell, the share that cut the price, the share that never sold.
Asking priceListed Jan–MarListed Apr–JunListed Jul–SepListed Oct–Dec
Under $750K62%5 days10% cut9% unsold59%6 days15% cut12% unsold44%7 days21% cut15% unsold40%8 days18% cut14% unsold
$750K to $1M57%5 days13% cut12% unsold50%6 days20% cut16% unsold37%8 days26% cut19% unsold34%8 days21% cut18% unsold
$1M to $1.5M49%6 days14% cut17% unsold43%6 days21% cut18% unsold34%8 days23% cut21% unsold32%7 days17% cut20% unsold
$1.5M to $2M38%7 days19% cut24% unsold34%8 days24% cut27% unsold31%12 days26% cut29% unsold24%15 days24% cut29% unsold
$2M and up19%22 days25% cut44% unsold18%23 days30% cut44% unsold14%27 days29% cut49% unsold16%27 days22% cut50% unsold

The best quarter in each row is outlined: the highest share of the original asking price, then the most sales over asking. Price ranges use the original asking price.

By county

Same calendar in every county.

Loudoun does not move like Arlington, but the season moves them the same way. In every county, homes listed January to March sold over asking most often.

Fairfax County32,721 homes listed, with the cities of Fairfax and Falls Church

Fairfax County: share of homes sold over asking by the months listed, Jan–Mar 59%, Apr–Jun 53%, Jul–Sep 42%, Oct–Dec 38%59%Jan–Mar53%Apr–Jun42%Jul–Sep38%Oct–Dec

Listed Jan–Mar: 12% cut the price and 14% never sold. Listed Jul–Sep: 23% and 20%.

Loudoun County14,160 homes listed

Loudoun County: share of homes sold over asking by the months listed, Jan–Mar 52%, Apr–Jun 47%, Jul–Sep 37%, Oct–Dec 33%52%Jan–Mar47%Apr–Jun37%Jul–Sep33%Oct–Dec

Listed Jan–Mar: 14% cut the price and 15% never sold. Listed Jul–Sep: 22% and 20%.

Prince William County17,181 homes listed, with Manassas and Manassas Park

Prince William County: share of homes sold over asking by the months listed, Jan–Mar 56%, Apr–Jun 52%, Jul–Sep 39%, Oct–Dec 34%56%Jan–Mar52%Apr–Jun39%Jul–Sep34%Oct–Dec

Listed Jan–Mar: 12% cut the price and 12% never sold. Listed Jul–Sep: 25% and 18%.

Arlington3,885 homes listed

Arlington: share of homes sold over asking by the months listed, Jan–Mar 50%, Apr–Jun 41%, Jul–Sep 30%, Oct–Dec 30%50%Jan–Mar41%Apr–Jun30%Jul–Sep30%Oct–Dec

Listed Jan–Mar: 14% cut the price and 22% never sold. Listed Jul–Sep: 24% and 27%.

City of Alexandria2,928 homes listed

City of Alexandria: share of homes sold over asking by the months listed, Jan–Mar 47%, Apr–Jun 43%, Jul–Sep 35%, Oct–Dec 29%47%Jan–Mar43%Apr–Jun35%Jul–Sep29%Oct–Dec

Listed Jan–Mar: 13% cut the price and 14% never sold. Listed Jul–Sep: 21% and 19%.

Houses and townhousesHouses Townhouses, % sold over asking

Sold over asking by the months listed: houses Jan–Mar 54%, Apr–Jun 49%, Jul–Sep 38%, Oct–Dec 35%; townhouses Jan–Mar 59%, Apr–Jun 54%, Jul–Sep 41%, Oct–Dec 36%5459Jan–Mar4954Apr–Jun3841Jul–Sep3536Oct–Dec

Townhouses sold faster in every season. Listed Jan–Mar: 11% of townhouses never sold, against 16% of houses.

The school bell

Ahmed’s rule of thumb, tested.

Ahmed has long told sellers with children to list between March and July, so the family can buy, move and settle before school starts. The numbers back March through June. July is cutting it close.

Closings by month

Share of each year’s closed sales, 2023 to 2025

Share of the year's closed sales by month, 2023 to 2025: January 4.8%, February 5.9%, March 7.7%, April 9.8%, May 11.3%, June 11.1%, July 9.8%, August 9.4%, September 7.8%, October 8.4%, November 7.1%, December 6.9%Schools open5%Jan6%Feb8%Mar10%Apr11%May11%Jun10%Jul9%Aug8%Sep8%Oct7%Nov7%Dec

Closings peak in May and June, 11.3% and 11.1% of the year’s sales, then ease toward school. From listing to closing, the median home took 35 days in March and 39 in July: a few days to find a buyer, then about a month to settle.

What waiting costs

Winter buyers pay a little less and choose from a lot less.

Prices follow the seasons. They dip in midwinter and peak with the spring closings, while the number of homes to choose from swings far more.

Price per square foot, by month closed

Houses Townhouses

Median price per square foot by the month a home closed, against that year's median (100), 2023 to 2025. Houses: Jan 97.3, Feb 98.4, Mar 100.2, Apr 101.0, May 101.7, Jun 100.5, Jul 100.7, Aug 99.0, Sep 99.5, Oct 100.2, Nov 99.6, Dec 100.2. Townhouses: Jan 96.6, Feb 96.8, Mar 100.5, Apr 101.6, May 102.6, Jun 100.8, Jul 101.9, Aug 99.2, Sep 100.1, Oct 100.8, Nov 98.8, Dec 98.4.9698100102Dashed line: 100 = that year's medianJanFebMarAprMayJunJulAugSepOctNovDec

Each month’s median price per finished square foot above ground, against that year’s median, averaged over 2023 to 2025.

New listings, by month

Share of each year’s new listings, 2023 to 2025

Share of the year's new listings by month, 2023 to 2025: January 5.7%, February 6.9%, March 10.3%, April 11.3%, May 12.1%, June 10.5%, July 9.2%, August 8.2%, September 9.2%, October 8.0%, November 5.3%, December 3.4%6%Jan7%Feb10%Mar11%Apr12%May10%Jun9%Jul8%Aug9%Sep8%Oct5%Nov3%Dec

May brings 3.6 times as many new listings as December.

Waiting for winter

About 3% less per square foot for January closings, but December brings only 3.4% of the year’s new listings. Good for a buyer who knows exactly what they want.

Waiting for late summer

Spring prices still hold, but far more sellers will negotiate: 23% to 24% of August to October listings cut the price. Good for a buyer who wants choice and leverage.

How it was done

Every listing, counted by the month it went on the market.

Most timing studies count sales by the month they closed, which mixes spring contracts into summer. This one follows each home from the month it was listed, including the homes that never sold.

Source
Bright MLS, the listing service Northern Virginia agents use, pulled by Ahmed Makkiyah: closed sales from January 1, 2023 to October 2, 2026, and every listing that expired, was withdrawn or was canceled from January 1, 2023 to October 8, 2026.1
What counts
Detached houses and townhouses owned outright (fee simple). Condos, co-ops and townhouses sold as condos are left out, and so are sales under $75,000.
Where
Fairfax, Loudoun, Prince William and Arlington counties and the cities of Alexandria, Fairfax, Falls Church, Manassas and Manassas Park.
The homes
70,875 homes listed from January 1, 2023 to December 31, 2025: 58,570 that sold by October 2, 2026, and 12,305 that did not.
Over asking
A sale price above the original asking price. A price cut means the asking price was lowered before the home sold.
Days to sell
The median days on market for that listing. A home taken off the market and relisted starts a new count, and its first listing counts as one that did not sell.
Medians
Every figure is a median or a share, never an average, so a few unusual sales cannot move it.
One caution
2025 was softer than 2023 and 2024 from spring on, and its best months came earlier, in January and February. In all three years, homes listed in February and March sold over asking more often than homes listed from June to August.

Questions

What people ask about timing a sale or a purchase.

What is the best month to sell a house in Northern Virginia?

March, with February and April close behind. Of the homes listed in March from 2023 to 2025, 58% sold for more than the original asking price, in a median of 5 days, and only 13% had to cut the price. In August the same figures were 38%, 8 days and 24%.

Is it better to buy a house in winter or summer in Northern Virginia?

Each has its advantage. Homes that closed in January sold for about 3% less per square foot than the year's median, but December brings only 3.4% of the year's new listings, so there is less to choose from. Late summer and fall bring more choice and more room to negotiate: 23% to 24% of homes listed from August to October cut their price, and only 35% to 38% sold over asking.

Do houses sell slower in the summer in Northern Virginia?

Yes, a little slower and with more price cuts. Homes listed from June to August sold in a median of 7 to 8 days against 5 for March, 20% to 24% cut the price, and 19% to 21% never sold, roughly one in five.

When should I list my house to move before school starts?

Fairfax County Public Schools open on August 23, 2027. Three in four homes listed in June closed within 56 days, so list by about June 28, 2027 to close in time with good odds. The median July listing took 39 days, so a listing after July 15 will more often than not close after school starts.

When is the best time to sell a luxury home in Northern Virginia?

January to March. Homes asking $2 million and up are slow in every season, a median 22 to 27 days, and 44% to 50% of them never sold. But those listed January to March sold for 98.1% of the original asking price (median), against 96.4% for July to September.

Do home prices drop in winter in Northern Virginia?

Only a little, and they come back each spring. Price per square foot for homes that closed in January ran about 3% below the year's median, and homes that closed in May about 2 to 3% above it, from 2023 to 2025. That is the season, not a falling market.

Your next step

Your street has its own calendar.

Tell me when you need to move. I answer in English or Arabic, with real numbers, not a pitch.

دليل شمال فرجينيا · دراسة السوق

متى يكون أفضل وقت لبيع المنزل أو شرائه في شمال فرجينيا؟

درسنا 70,875 منزلاً، بين منزل مستقل ومنزل متلاصق («تاون هاوس»)، من دون الشقق، عُرضت للبيع بين 1 يناير 2023 و31 ديسمبر 2025، بحسب سجلات «برايت إم إل إس». والنتيجة أن المنازل التي عُرضت في فبراير ومارس حققت أفضل النتائج: بِيع ما بين 57 و58 في المئة منها بسعر أعلى من السعر المطلوب، وكانت المدة الوسطية للبيع 5 أيام، ولم يُخفَّض السعر إلا في نحو 12 في المئة منها.

أما المنازل التي عُرضت في الصيف، من يونيو إلى أغسطس، فكانت نتائجها أضعف: بِيع ما بين 38 و46 في المئة منها بسعر أعلى من المطلوب، وخُفِّض السعر في ما بين 20 و24 في المئة منها، ولم يُبَع نحو منزل واحد من كل خمسة. وأمام المشترين أكبر فرصة للتفاوض على المنازل التي تُعرض بين أغسطس وأكتوبر. أما المنازل التي يبلغ سعرها مليوني دولار أو أكثر، فبيعها أبطأ في كل المواسم، لكنها هي أيضاً حققت أفضل نتائجها حين عُرضت بين يناير ومارس.

ولمن يريد الانتقال قبل بدء العام الدراسي: تفتح مدارس مقاطعة فيرفاكس أبوابها في 23 أغسطس 2027، وقد اكتمل بيع ثلاثة من كل أربعة منازل عُرضت في يونيو خلال 56 يوماً من عرضها، لذا يُستحسن عرض المنزل للبيع قبل نحو 28 يونيو 2027.

وكيلك العقاري الموثوق في شمال فرجينيا.

Keep exploring

More on the Northern Virginia market.