
Northern Virginia weather and the four seasonsRain, humidity, snow and what to expect in 2026
What each season feels like, the numbers month by month for the colder west and the warmer close-in suburbs, and what the weather means for the house you buy.
Updated October 7, 2026NOAA and the National Weather Service, Virginia Department of Forestry, National Park Service, county building codesAbout a 14-minute read
 Written byAhmed MakkiyahREALTOR®, Douglas Realty of Virginia · English and ArabicMobile 734.383.6945 · Direct 703.957.0060
Quick answer
Northern Virginia has four distinct seasons. Summers are hot and humid, with July highs averaging about 88°F at Washington Dulles and about 90°F at Reagan National. Winters are cool, with January lows near 25°F at Dulles and 30°F at National, and about 21 inches of snow a year in the west against about 14 close in. Rain and snow fall on roughly one day in three, about 42 to 43 inches a year. Spring and fall are the long, mild reward: cherry blossoms in late March or early April, and peak leaves in late October.
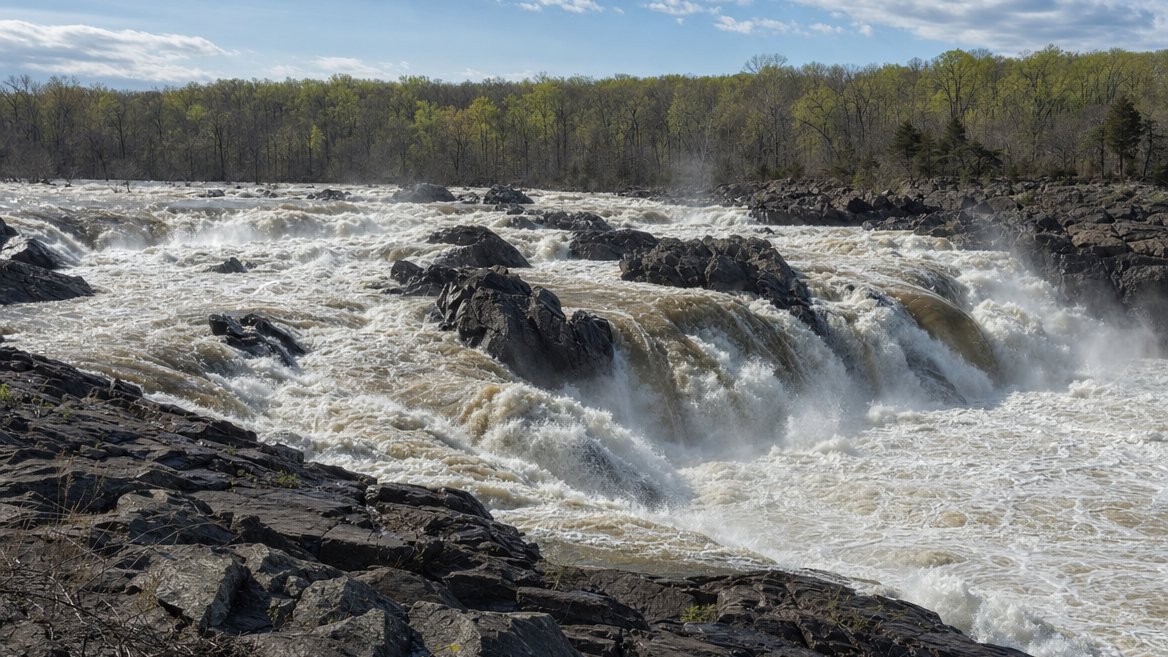
The year in six numbers
NOAA 1991 to 2020 normals unless noted
Washington Dulles International Airport (294 feet above sea level, on the Loudoun and Fairfax line) stands in for Loudoun, western Fairfax and Prince William. Reagan National Airport (13 feet, on the Potomac in Arlington) stands in for Arlington, Alexandria and eastern Fairfax. Day counts are 1991 to 2020 averages computed from NOAA station records.
The four seasons
Four real seasons, each with its own start date.
I have been a licensed REALTOR in Northern Virginia since 2019, and people moving here from warmer or colder places want to know what a year actually feels like. Here it is, season by season, with the dates that mark the turn. Each card reads Dulles first, then Reagan National.
-
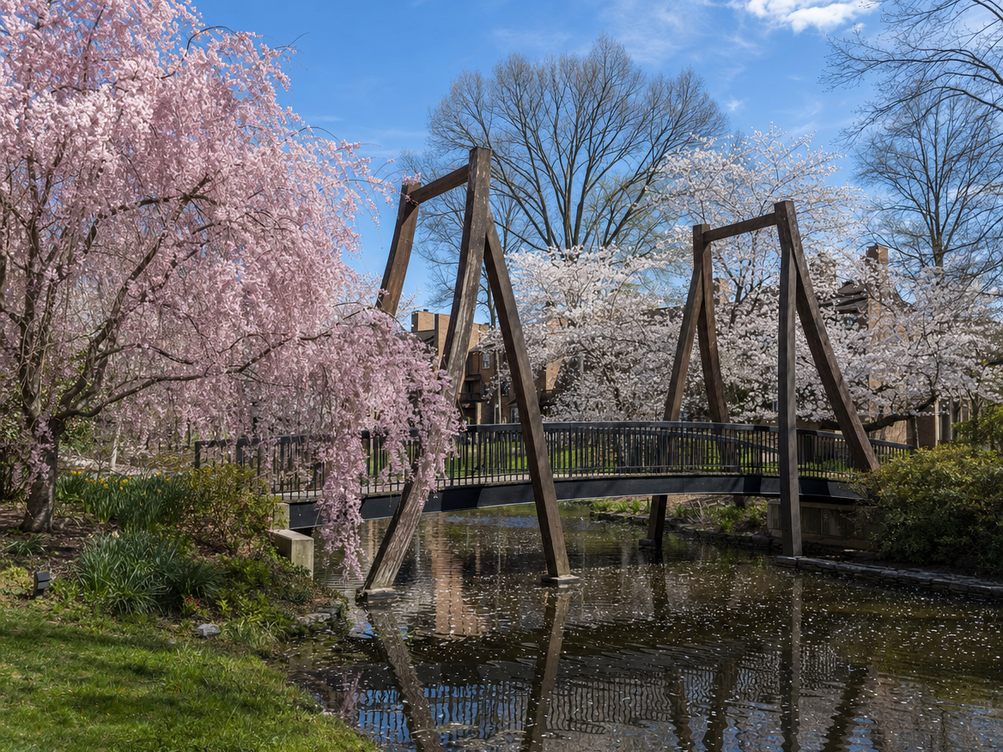
Weeping cherries in bloom over the Van Gogh Bridge at Lake Anne in Reston. Spring
Fast and fresh
March to May, from the last freeze
Average highs climb from about 55°F in March to 75°F in May at Dulles. Cherry blossoms open, tree pollen follows, and May is the wettest month at Dulles, with 4.72 inches.1
- April high
- 66.8° / 68.0°
- Last freeze, average
- Apr 19 / Mar 24
- Cherry blossom peak, 2026
- Mar 26
-
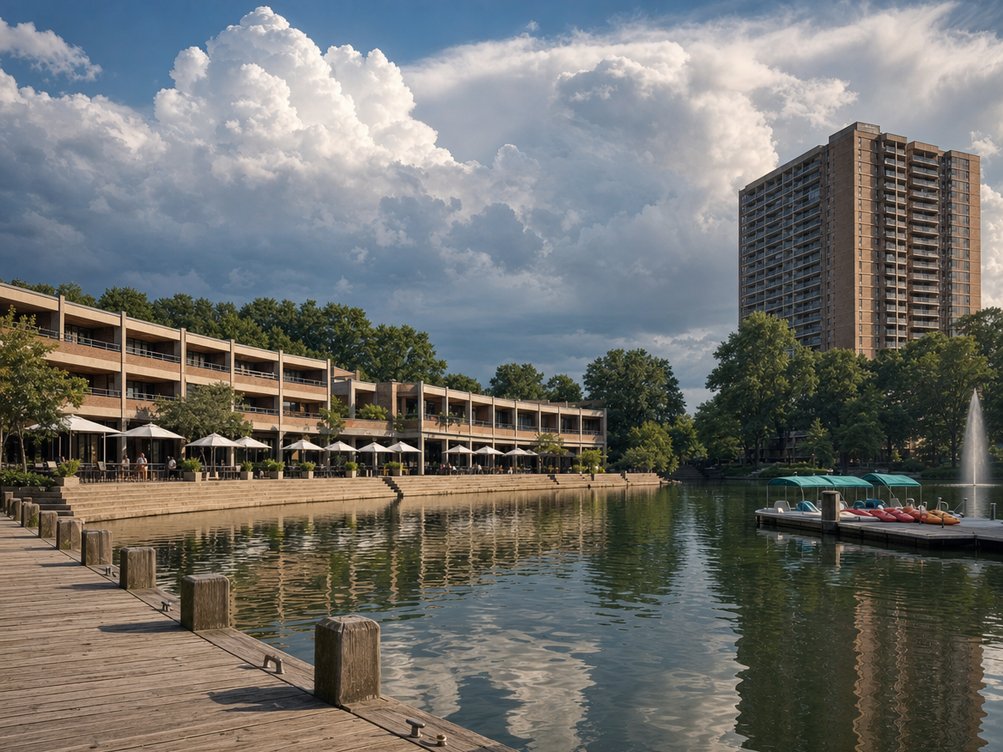
July thunderheads building over the brick crescent of Lake Anne Plaza in Reston. Summer
Hot, humid, stormy
Late May to mid-September
Weather Spark's model puts the hot season, when average highs top 78°F, at about May 30 to September 16.5 Expect muggy air and late-afternoon thunderstorms, with July the peak for both.6
- July high
- 87.6° / 89.6°
- 90°F days a year
- 33 / 40
- Muggy days in July (model)
- About 19
-
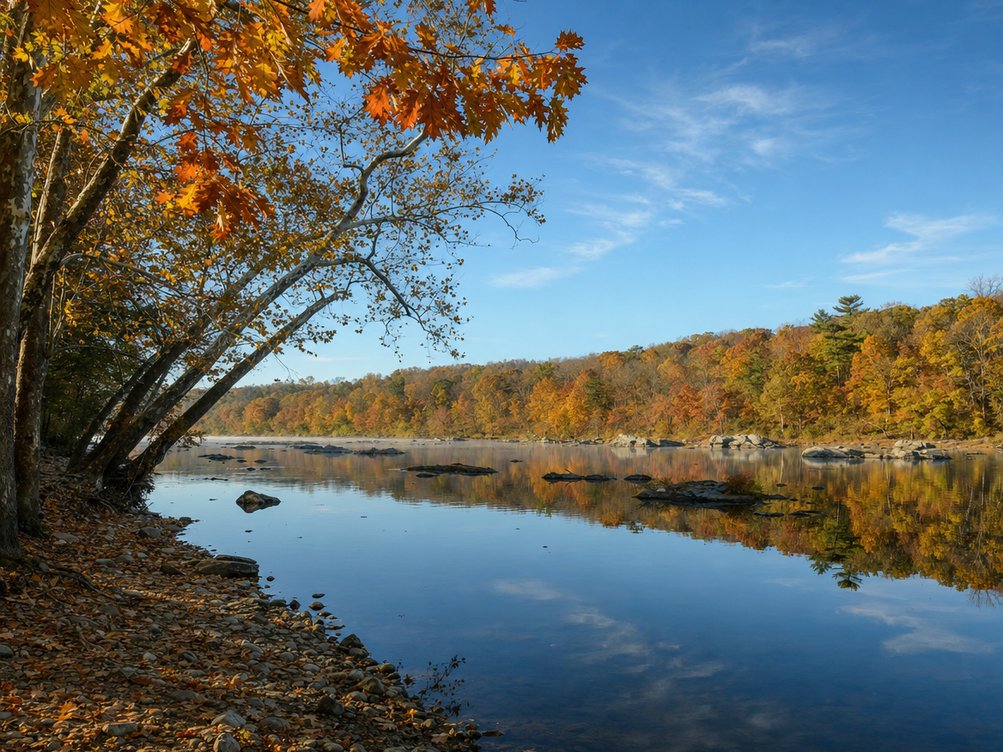
Late-October color along the Potomac at Riverbend Park in Great Falls. Fall
Clear and golden
Mid-September to the first freeze
The heat breaks and the nights cool. Weather Spark's model calls September the clearest month of the year.5 Leaves peak in the last third of October, and the first freeze follows.7
- October high
- 67.8° / 69.4°
- First freeze, average
- Oct 19 / Nov 17
- Peak color
- Oct 20 to 31
-
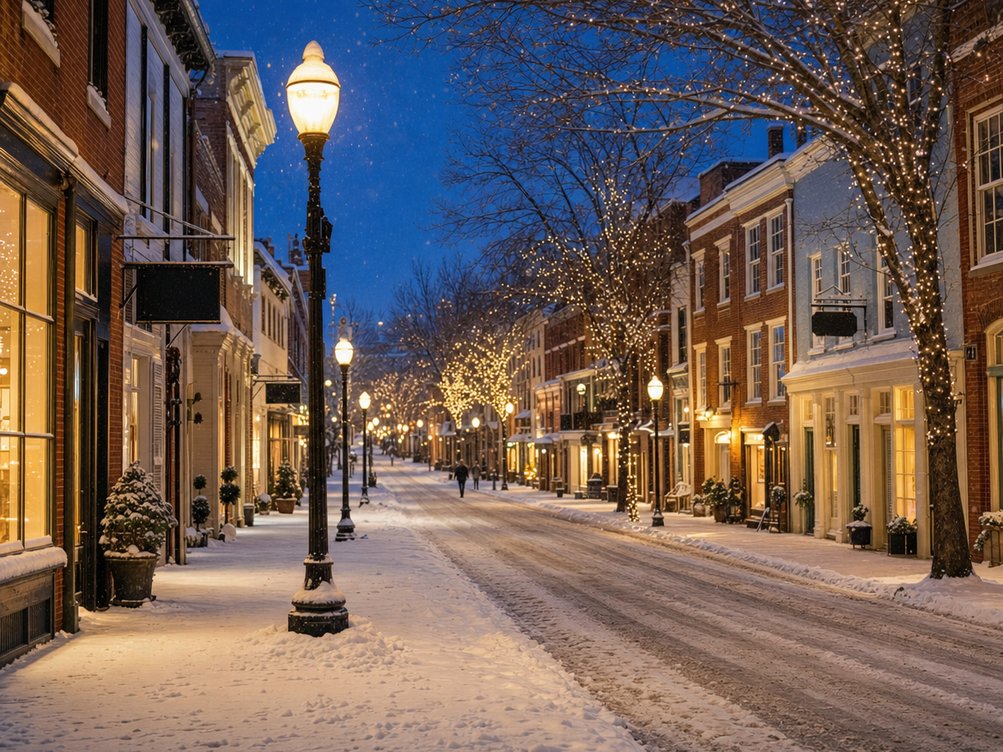
Fresh snow on the brick sidewalks and storefronts of King Street in Old Town Alexandria. Winter
Cold, with a few storms
December to February
January is the coldest month and February the snowiest, by a hair: 7.0 inches at Dulles against January's 6.9. Most winters bring a handful of snow days, and a big storm every few years.1,8
- January low
- 25.2° / 30.1°
- Snow a year
- 21.0" / 13.7"
- Nights at 20°F or colder
- 25 / 10
Freeze dates are Capital Weather's averages for each airport.9,10 Weather Spark figures come from its model, which blends NASA reanalysis data with the local airport stations, and are labeled as such. Peak color is the Virginia Department of Forestry's range for eastern Virginia, which includes Northern Virginia.
Northern Virginia has a cooler, snowier west and a warmer, river-tempered east. Which one you live in shows up in the heating bill, the snow shovel and the garden.
Ahmed Makkiyah
Month by month
Highs, lows, rain and snow, month by month.
These are NOAA's official 1991 to 2020 normals for the two airports that stand in for the region.1,2
Average high and low temperature by month, °F
Dulles highDulles lowReagan National highReagan National low
NOAA 1991 to 2020 normals, from the National Weather Service in Sterling.1,2
National runs warmer in every month, but the gap is small by day and wide at night. Average highs at the two airports differ by only 1 to 2.5 degrees; average lows differ by 5 to 7.
July is the peak at both: 87.6°F by day and 66.8°F at night at Dulles, 89.6°F and 72.4°F at National. January is the bottom: 42.6°F and 25.2°F at Dulles, 44.8°F and 30.1°F at National.
Over a whole year, that averages out to 59.3°F at National and about 55.7°F at Dulles.2
| Month | Dulles | National | Precip, Dulles | Precip, National | Rain days, Dulles | Snow, Dulles | Snow, National |
|---|---|---|---|---|---|---|---|
| Jan | 42.6° / 25.2° | 44.8° / 30.1° | 2.94 | 2.86 | 10.3 | 6.9 | 4.9 |
| Feb | 46.1° / 26.7° | 48.3° / 31.8° | 2.61 | 2.62 | 9.0 | 7.0 | 5.0 |
| Mar | 54.8° / 33.6° | 56.5° / 38.6° | 3.50 | 3.50 | 11.0 | 3.9 | 2.0 |
| Apr | 66.8° / 43.2° | 68.0° / 48.4° | 3.47 | 3.21 | 11.0 | 0.1 | 0.0 |
| May | 75.0° / 53.0° | 76.5° / 58.0° | 4.72 | 3.94 | 12.7 | 0.0 | 0.0 |
| Jun | 83.1° / 61.9° | 85.1° / 67.5° | 4.30 | 4.20 | 10.8 | · | · |
| Jul | 87.6° / 66.8° | 89.6° / 72.4° | 4.15 | 4.33 | 11.0 | · | · |
| Aug | 86.3° / 65.2° | 87.8° / 71.0° | 3.53 | 3.25 | 9.3 | · | · |
| Sep | 79.3° / 57.9° | 80.7° / 64.1° | 3.94 | 3.93 | 9.0 | · | · |
| Oct | 67.8° / 45.3° | 69.4° / 52.2° | 3.65 | 3.66 | 8.1 | 0.0 | 0.0 |
| Nov | 56.5° / 35.6° | 58.2° / 41.6° | 3.13 | 2.91 | 8.6 | 0.3 | 0.1 |
| Dec | 46.5° / 29.0° | 48.8° / 34.5° | 3.30 | 3.41 | 10.2 | 2.8 | 1.7 |
| Year | 66.0° / 45.3° | 67.8° / 50.9° | 43.24 | 41.82 | 121 | 21.0 | 13.7 |
A dot means no measurable snow in the normals for that month. Rain days come from NOAA station records through the Regional Climate Centers' ACIS system, the same data behind the National Weather Service's NOWData tool.3
Rain
Rain is spread through the year, with no true dry season.
Dulles averages 43.24 inches of precipitation a year and Reagan National 41.82.1,2 No month is truly dry. At Dulles the lowest monthly average is February's 2.61 inches and the highest is May's 4.72, so you will water a new lawn in a hot August, but you will rarely go a month without a soaking.
Measurable rain or snow falls on about 121 days a year at Dulles and 117 at National, roughly one day in three.3 Spring has the most wet days; October and November the fewest.
Summer rain comes in bursts. The National Weather Service counts about 7 thunderstorm days in an average July in Washington, 6 in June and 5 each in May and August, with storms peaking in the late afternoon and early evening.6 That is why a sunny July day can turn into a 5 p.m. downpour.
Days with measurable rain or snow, by month
DullesReagan National
Days with at least 0.01 inch, 1991 to 2020 average.3 May is the busiest month at Dulles, with 12.7 days, and October the quietest, with 8.1.
Thunderstorm days in an average month, Washington
From a National Weather Service forecaster's study of 37 years of observations.6
Humidity
The muggy season runs about four months.
Summer here is humid, not just hot. The thermometer is half the story; the dew point is the other half.
Weather Spark counts a day as muggy when the dew point reaches 65°F, and its model puts Fairfax's muggy season at roughly May 25 to September 25, peaking around July 28.5 NOAA's older 1961 to 1990 normals put the average dew point at Reagan National at 66.0°F in July and 65.8°F in August, and the average relative humidity highest in September, at 69.7%.11
The National Weather Service describes the region's classic "suffocating" summer day as something like 95°F with a 70°F dew point, mostly in July and August.6 On those days the air feels heavy by 9 a.m., and a shaded porch matters more than a sunny deck.
The nights are where close in and out west part ways. Reagan National averages 61 nights a year that never drop below 70°F, against 23 at Dulles.3 That is the city's heat and the river at work, and it is why an evening walk in Old Town Alexandria in August can feel warmer than one in Leesburg.
Snow
About 21 inches a year in the west, 14 close in.
Snow is part of most winters, though it rarely stays long. Dulles averages 21.0 inches a year and Reagan National 13.7, almost all of it from December through March.1,2
Average monthly snowfall, inches
DullesReagan National
NOAA 1991 to 2020 normals.1,2 October and May average no measurable snow at either airport.
| Snowfall | Dulles | Washington |
|---|---|---|
| Days a year with 1"+ | 5.4 | 5.2 |
| Days a year with 4"+ | 1.8 | 1.3 |
| Days a year with 6"+ | 0.8 | 0.6 |
| Days a year with 10"+ | 0.3 | 0.2 |
| A 12"+ storm | 1 year in 5 | 1 year in 8 |
Snow-day frequencies are the National Weather Service's averages over each station's full record; 12-inch storms count three-day totals, since 1962 at Dulles and since 1884 in Washington.8 A rate of 0.8 days a year means it happens in about 4 years out of 5. Over 1991 to 2020 alone, Dulles averaged 5.2 days a year with an inch or more and National 3.7.3
The storms people still talk about
- February 5 to 6, 2010
Snowmageddon
32.4"The biggest storm on record at Dulles; 17.8 inches at National. February 2010 brought Dulles 46.1 inches, its snowiest month ever, and 45.7 of them fell in the first ten days.8,12
- January 22 to 23, 2016
Snowzilla
29.3"The second-biggest storm at Dulles, with 22.1 inches on January 23 alone. National measured 17.8 inches, a total a NOAA review later confirmed.8,13
- January 6 to 8, 1996
The Blizzard of '96
24.6"At Dulles, with 17.3 inches at National.8
- January 27 to 29, 1922
The Knickerbocker storm
28.0"Washington's biggest storm of all, measured before either airport kept records.8
Seasons swing widely. The snowiest on record was 2009 to 2010, with 73.2 inches at Dulles and 56.1 at National. The least snowy: 0.4 inch at Dulles in 2022 to 2023, and 0.1 inch at National in both 1997 to 1998 and 1972 to 1973.8
Deep cold is a western story. From 1962 to 2024 Dulles logged 62 days below zero, 5 of them since 2000; Washington logged 4.8 Ice can be worse than snow: the National Weather Service calls 1993 to 1994 one of the iciest winters on record, with 19 to 23 days of icy precipitation, and the February 10 to 11, 1994 storm brought a Presidential Disaster declaration.8
If you are choosing between two houses, look at the driveway with January in mind. A steep, shaded drive is a small thing in May and a daily chore after an ice storm.
West vs close in
The colder, snowier west and the warmer close-in suburbs.
Dulles sits inland on the Loudoun and Fairfax line; Reagan National sits on the river in Arlington. The same region, but the numbers between them differ more than most buyers expect.
Nights at or below freezing, a year
About 42 more freezing nights at Dulles.3
Days at 90°F or hotter, a year
About 7 more hot days at National.3
Nights that stay at 70°F or warmer, a year
About 2.6 times as many warm nights at National.3
| Measure | Dulles | Reagan National |
|---|---|---|
| Days at 90°F or hotter | 32.7 | 40.0 |
| Days at 100°F or hotter | 0.6 | 1.3 |
| Nights at or below 32°F | 101.9 | 60.3 |
| Nights at or below 20°F | 25.1 | 9.9 |
| Days that stay at or below 32°F | 10.8 | 7.4 |
| Nights at 70°F or warmer | 23.2 | 61.1 |
| Days with 0.1" or more of snow | 9.7 | 8.0 |
| Snowfall | 21.0" | 13.7" |
Freeze dates show the gap best. Capital Weather puts the average last spring freeze at April 19 at Dulles and March 24 at National, and, using 1991 to 2020 data, the average first fall freeze at October 19 at Dulles and November 17 at National.9,10 That is a growing season of roughly six months at Dulles and closer to eight at National.
In practice: if you garden in Ashburn or Leesburg, plant tomatoes later and cover them sooner than a friend in Arlington. And if you are weighing a commute against a bigger lot farther west, count on a few more snow days and colder mornings in the trade.
Blossoms, pollen, leaves
The dates that mark the year.
Cherry blossoms
Late March to early April
The National Park Service says peak bloom most often lands between the last week of March and the first week of April. It peaked on March 26 in 2026, March 28 in 2025 and March 17 in 2024; the record range runs from March 15 (1990) to April 18 (1958).14
Pollen
March through October
Fairfax County's Health Department says tree pollen starts in early March and peaks in April and May, grass follows in late spring and early summer, and ragweed and other weeds arrive in late summer and early fall.15 Keep windows closed on high-count days and change HVAC filters on schedule.
Fall color
October 20 to 31
The Virginia Department of Forestry puts peak color across Virginia between October 10 and 31: western Virginia first (October 10 to 20), central Virginia next (October 15 to 25), and eastern Virginia, which takes in Northern Virginia on its map, last (October 20 to 31).7
Storms and floods
Wind and water do the real damage here.
The National Weather Service in Sterling says severe thunderstorms cause most of the region's wind damage, and that wind damage from them is 10 times more likely than from a tornado.16 Flooding, mostly from tropical remnants and sudden downpours, is the other big risk.17
- June 29, 2012
The derecho
1.2 millionCustomers without power in the D.C. area alone. Gusts reached 71 mph at Dulles and 70 at National, and a power failure at a key communications site knocked out 911 service in Northern Virginia for a time.18
- June 1972
Agnes
11.88"Of rain in 24 hours at Dulles, 5.74 of it in six hours.17
- September 1996
Fran
3 ft+Of water in the streets of Old Town Alexandria, partly evacuated during record Potomac flooding.17
- September 2003
Isabel
2 million+Without power, with a storm surge 6 to 8 feet above normal up the Chesapeake and Potomac.17
- September 6 to 9, 2011
Remnants of Tropical Storm Lee
6.57"In six hours in Reston, with 12 inches or more in many places. The Beltway, I-66 and the George Washington Parkway flooded, and hundreds of people were evacuated in Fairfax and Prince William.19
- July 8, 2019
The one-hour flood
3.30"Of rain in one hour at National, the most since at least 1948 and roughly a 1-in-100 chance in any year.20
Flooding is local, and it can be fixed. In Huntington, in Fairfax County, 160 homes sat in the FEMA floodplain, exposed to tidal surge from the Potomac and flash floods on Cameron Run. After three damaging floods since 2002, the county built a levee and pump station, finished in 2019.21
Before you write an offer, look the address up on the FEMA flood map and ask the sellers about any water in the basement. I would rather you know on day one than at the home inspection.
2025 and 2026
Drought, record heat and a cold January.
Normals describe the average year. The last two show how far a single year can stray from it.
- 2025
A dry year at Dulles
30.17"Of rain and melted snow, the fourth-driest year on record at Dulles (records began in 1962), against a normal of 43.24.22 National had just 0.20 inch in August 2025, against a normal of 3.25.3
- Summer 2025
Hot days, warm nights
99°FAt National on June 24, 2025, with 18 days at 90°F or more that July.3 NOAA noted record-warm July nights across the Mid-Atlantic.22
- January 2026
A real winter month
3°FAt Dulles on January 27, 2026. January brought 8.2 inches of snow at Dulles and 7.0 at National, yet the season ended below normal: about 13.6 inches at Dulles and 10.6 at National.3
- July 4, 2026
The hottest Fourth
103°FAt National, its third record high in a row and the hottest July 4 on record. Dulles hit 99°F the same day.23,3
Days at 90°F or hotter: 2026 so far against a normal year
2026 counts run April through September and are preliminary until NOAA finalizes them; normals are 1991 to 2020 annual averages.3 Spring started early, too: March 2026 ran 6.8°F above normal at Dulles, and Dulles reached 92°F on April 16.
Your house
What the weather means for the house you buy.
The building codes here are written for this climate, and a good home inspection reads a house against it. Here is what the counties require, and what I look at with every buyer.
| Criterion | Requirement |
|---|---|
| Frost depth | 24 inches |
| Ground snow load | 25 pounds per square foot |
| Ice shield underlayment at the eaves | Required |
| Winter design temperature | 17°F |
| Ultimate design wind speed | 115 mph (homes) |
| Weathering risk for concrete | Severe |
| Termite risk | Moderate to heavy |
| Decay risk | Slight to moderate |
Footings go 24 inches down across the region. Fairfax's typical deck details say footings must bear on solid ground 24 inches below grade;25 Loudoun lists a 24-inch frost depth;26 and Prince William asks for 24 inches or until solid bearing soil is reached.27
Loudoun designs for more snow. Its ground snow load is 30 pounds per square foot, against Fairfax's 25,26,24 which fits its colder, snowier climate.
Every jurisdiction here is Climate Zone 4A, "mixed-humid."4 The U.S. Department of Energy says heat pumps work well in mixed climates and can be an efficient alternative to a furnace and air conditioner.28,29 In western Loudoun, where Dulles averages about 25 nights a year at 20°F or colder and has logged 62 days below zero since 1962,3,8 I suggest asking whether a heat pump is rated for cold climates or has backup heat.
Heating and cooling degree days a year (base 65°F)
1991 to 2020 averages computed from NOAA station records.3 A degree day measures how far a day's average temperature sits from 65°F; more heating degree days means a bigger heating bill.
Heating season runs roughly October through April, and about 83% of Dulles's heating demand falls between November and March. Cooling season runs roughly May through September, with about 88% of National's cooling demand from June to September.3
Put simply, a house near Dulles needs about 19% more heating and about 26% less cooling than the same house near National. January is the peak heating month at both airports, July the peak cooling month.3
What I check when a client is buying
Grading and drainage
The ground should slope away from the foundation and the downspouts should carry water well clear of it. Tropical remnants and one-hour cloudbursts are how basements here get wet.
The sump pump and the basement
Is there a pump, does it run, and does it have a battery backup? Look for stains, fresh paint low on the walls and dehumidifiers, and check the FEMA flood map.
The roof, the eaves and the trees
Ask the roof's age and whether ice shield runs along the eaves, as Fairfax's code requires. Note big trees leaning over the house: thunderstorm winds do most of the damage here.
HVAC age and type
Get the age of the heat pump or furnace and air conditioner and the service records. Out west, ask how the system handles the coldest nights.
Backup power
After the 2012 derecho left about 1.2 million customers dark, a generator, a transfer switch or at least a backup for the sump pump is worth a look.
Termites, decks and footings
Termite risk is rated moderate to heavy, so get a wood-destroying insect inspection. On older decks, ask whether the footings were permitted at 24 inches.
Selling? Do the same list first. Fix drainage, service the heating and cooling, and gather the roof and HVAC receipts; the buyer's inspector will ask about all of it.
From Ahmed
Weather is part of every house decision here.
The basement after a summer storm, the driveway in January, the electric bill in July: these are practical questions, and they belong in the house hunt from the start. I have worked with buyers and sellers across Fairfax, Loudoun and Prince William since 2019, in English and Arabic.
If you are weighing a town farther west against one closer in, I can walk you through what changes, from the snow load on the roof to the commute, with the numbers in front of you.
Questions
What people ask about Northern Virginia weather.
Does Northern Virginia have four seasons?
Yes, four distinct ones. Average highs run from about 43°F in January to about 88°F in July at Washington Dulles, with a mild, flowering spring and a long, colorful fall in between. Winter brings some snow most years, and summer is hot and humid from late May into September.
How much snow does Northern Virginia get a year?
About 21 inches a year at Washington Dulles and about 14 inches at Reagan National, based on NOAA's 1991 to 2020 normals. February and January are the snowiest months. A storm of 12 inches or more comes about once every five years at Dulles and about once every eight years in Washington.
When is it most humid in Northern Virginia?
Summer. Weather Spark's model puts the muggy season in Fairfax at roughly May 25 to September 25, with July the muggiest month at about 19 muggy days. July and August average a dew point of about 66°F at Reagan National in NOAA's 1961 to 1990 normals.
Is Loudoun County colder than Arlington?
Yes. Washington Dulles, on the Loudoun and Fairfax line, averages about 102 nights a year at or below freezing, against about 60 at Reagan National in Arlington, and gets about 21 inches of snow a year against about 14. Arlington, Alexandria and eastern Fairfax get more 90°F days and many more warm nights.
When do the leaves change and the cherry blossoms bloom?
The Virginia Department of Forestry puts peak fall color in eastern Virginia, which includes Northern Virginia, at October 20 to 31. The National Park Service says the cherry blossoms most often peak between the last week of March and the first week of April; in 2026 they peaked on March 26.
What should I check on a house because of Northern Virginia weather?
Look at how the yard drains away from the foundation and whether the basement has a working sump pump, since tropical remnants and summer downpours bring the region's worst flooding. Ask the age of the heating and cooling system, check the roof for ice-dam protection at the eaves, and think about backup power: the 2012 derecho left about 1.2 million customers in the D.C. area without electricity.
Your next step
Moving to Northern Virginia? Start with the right house.
Tell me what you are looking for and when. I answer in English or Arabic, with real numbers, not a pitch.
دليل شمال فرجينيا · الطقس والفصول
طقس شمال فرجينيا: أربعة فصول واضحة
في شمال فرجينيا أربعة فصول مميزة. الصيف حار ورطب، ويبلغ متوسط درجة الحرارة العظمى في يوليو نحو 88 درجة فهرنهايت في مطار دالاس. والشتاء بارد، ويتساقط نحو 21 بوصة من الثلج سنوياً في الغرب مقابل نحو 14 بوصة في المناطق القريبة من العاصمة. أما الربيع والخريف فمعتدلان: تتفتح أزهار الكرز في أواخر مارس أو أوائل أبريل، وتبلغ ألوان الخريف ذروتها في أواخر أكتوبر.
عند شراء بيت، انتبه إلى تصريف مياه الأمطار بعيداً عن الأساسات، ووجود مضخة صرف تعمل في القبو، وعمر نظام التدفئة والتكييف، وحماية السقف من الجليد عند الحواف. راسلني بالعربية أو بالإنجليزية، وسأجيبك بالأرقام.
وكيلك العقاري الموثوق في شمال فرجينيا.
Keep exploring
Pick the part of Northern Virginia that fits you.
Fairfax County
20 places compared.
Open the guide County guideLoudoun County
15 places compared.
Open the guide County guidePrince William County
Every town compared.
Open the guide County guideArlington
By zip code.
Open the guide What's being builtThe big projects
HQ2, data centers, hospitals and more, county by county.
Read the guide Seller guideSelling a house
Costs, timing and pricing in 2026.
Read the guide