

Risky loans
200818.4%
of 2005 mortgages in Prince William County came from subprime lenders.5
Now96.9%
of Virginia mortgages today are fixed rate. The payment cannot reset.7
Northern Virginia Guide › Will prices crash?
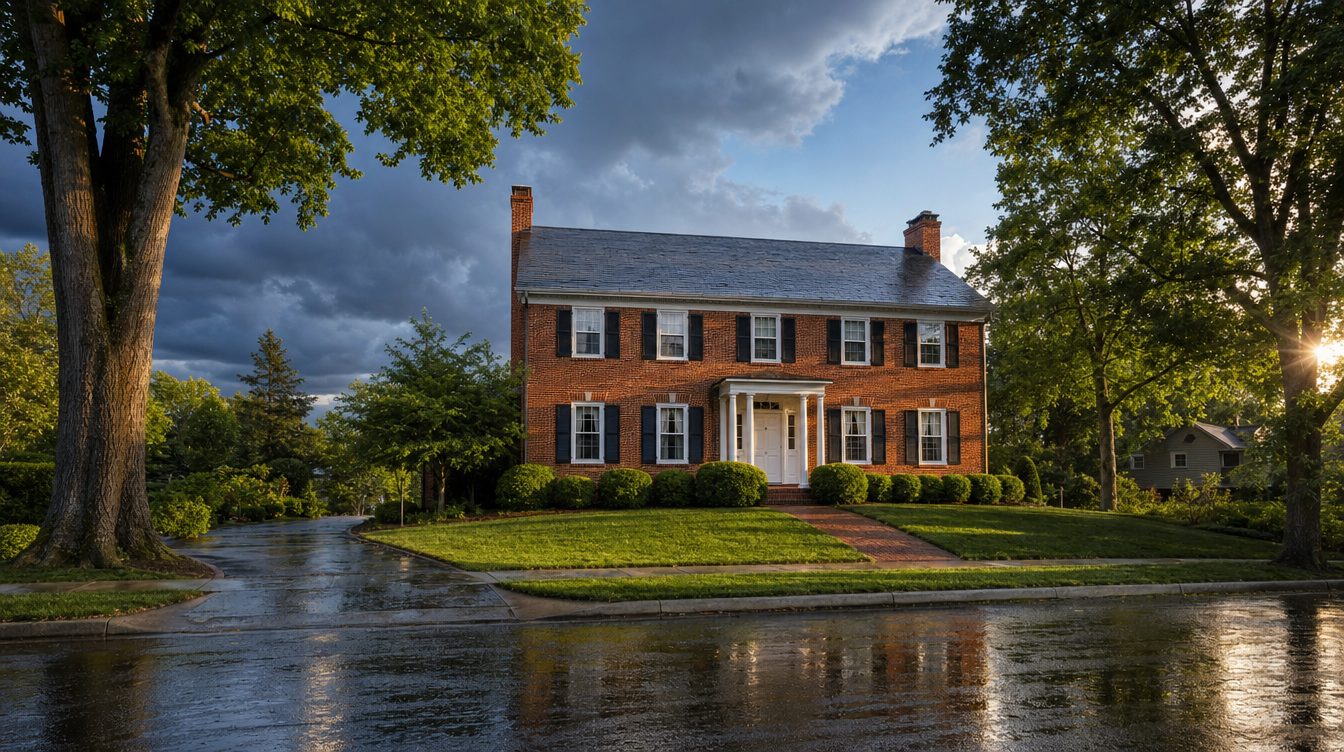
A crash needs risky loans, too many new homes and forced sellers. Right now Northern Virginia has none of the three.
Updated October 6, 2026Freddie Mac, Fairfax County, Census, CFPB, FHFA, Zillow and the three local REALTOR associationsAbout a 9-minute read
Short answer
No. Nothing in the data points to a 2008-style crash in Northern Virginia. In 2008, risky loans and a building boom led to waves of forced sales. Today 96.9% of Virginia mortgages are fixed rate, only 0.2% to 0.7% of county mortgages are 90 or more days late, and the counties build a fraction of what they did in 2004. Forecasts for 2026 run from −0.2% to +4.2%. The soft spot is condos.
Each one dated and sourced below
2019 to 2026
If high rates alone could crash Northern Virginia, it would have happened in 2022. Fairfax County's average sale price rose every single year from 2019 to 2025, 46.9% in all.
2.65% The lowest 30-year rate on record, week of January 7, 2021.
7.28% The rate in the week of October 1, 2026, the latest at the time of writing.
2026 rate: average of the weeks from January 8 to October 1, 2026. 2026 price: July 2026 alone, the latest month Fairfax County has published. Fairfax County publishes a yearly average for every year; a yearly median is not public for every year, so this chart uses the average throughout.
Rates fell to the lowest on record. Buyers rushed in, and Fairfax County's average sale price rose 8.4% in 2020 and 8.7% in 2021.
The weekly rate more than doubled within one year, the fastest jump in four decades of data. Prices still rose 7.4%.
Rates stayed between 6.6% and 6.8% on average. Prices kept rising every year, more slowly in 2023 and 2025.
July's average sale price was 1.7% above 2025's average. Listings are up and sales are down, the pattern of a cooling market.
Before you trust that video
Most "the crash is coming" videos on YouTube, TikTok and Instagram are about Florida, Texas or the country as a whole. You cannot copy those numbers onto Northern Virginia. Even here, some parts of the market are rising, some are flat and one is soft.
August 2026 figures cover all home types unless a row says otherwise. Forecasts are for the full year 2026.
From my own MLS pull
I pulled every house, townhouse and condo sale in Fairfax, Loudoun, Prince William and Arlington counties and the Cities of Alexandria, Fairfax, Falls Church, Manassas and Manassas Park, for January 1 to October 2 in 2025 and again in 2026. Same nine months, same places, so the comparison is fair. The median sale price is shown with its change from the same period in 2025.
Houses
Detached, 3+ bedrooms, 2+ full baths
$960,000
+1.9% vs $942,000 in 2025
9,813 sales in 2026, 9,650 in 2025
Townhouses
Owned outright (fee simple)
$650,000
+0.8% vs $645,000 in 2025
5,764 sales in 2026, 5,475 in 2025
Condo townhouses
Townhouses owned as condominiums
$510,000
−1.4% vs $517,000 in 2025
1,497 sales in 2026, 1,549 in 2025
Condos
Apartment-style units
$378,750
+1.0% vs $375,000 in 2025
3,762 sales in 2026, 3,807 in 2025
| Place | Houses | Townhouses | Condos |
|---|---|---|---|
| Fairfax County | +1.5%$1,005,000 | −0.3%$650,000 | −1.5%$354,900 |
| Loudoun | +2.1%$1,095,000 | +0.7%$700,000 | −6.8%$400,000 |
| Prince William | +2.8%$740,000 | +4.0%$525,000 | +38.8%*$447,500 |
| Arlington | +0.0%$1,400,500 | −2.8%$1,037,500 | +4.2%$433,000 |
| City of Alexandria | +8.0%$1,350,000 | +2.7%$915,000 | +1.4%$365,000 |
Source: Bright MLS, closed sales January 1 to October 2, 2025 (20,936) and January 1 to October 2, 2026 (21,362); 5,124 homes for sale on October 6, 2026. Houses are detached homes with 3 or more bedrooms and 2 or more full baths. Days to sell is the median cumulative days on market. Price per square foot uses finished space above ground, so it reads high for homes with finished basements. Months of supply is the homes for sale on October 6 divided by the average month of closed sales in 2026. Likely typos were left out: sales under $75,000 or over $15 million, and square footage or sale-to-list figures that cannot be right. The Cities of Fairfax, Falls Church, Manassas and Manassas Park are in the totals but have too few sales of each type for their own row. *Prince William condos: 113 of the 282 sold in 2026 were in buildings finished in 2024 or later, which lifted the median. It is not a like-for-like gain.
The pattern is clear. Houses and townhouses still sell in about a week, and four in ten go above the original price. Condos have slowed: they take three weeks, fewer than one in five sells above the original price, and there are almost twice as many months of supply. That is a soft corner of the market, not a crash.
The recipe
Prices only collapse when many owners must sell at the same time. That takes loans people cannot pay, more homes than buyers, and a wave of foreclosures. Here is each one, then and now.
of 2005 mortgages in Prince William County came from subprime lenders.5
of Virginia mortgages today are fixed rate. The payment cannot reset.7
single-family homes permitted in Prince William County in 2004.3
permitted there in 2025, 86% fewer.3
of Prince William mortgages were 90+ days late at the peak, January 2010.6
were 90+ days late in September 2025.6
Honest history
Anyone who says "Northern Virginia never crashes" is wrong. What matters is why it happened, and whether the same machine is running today.
The more subprime lending a county had, the further it fell (subprime share: Urban Institute5). Prince William got its peak price back in May 2021, Loudoun in October 2020, Fairfax in December 2017 and Arlington in October 2013. Those are prices in the dollars of each year, not adjusted for inflation.
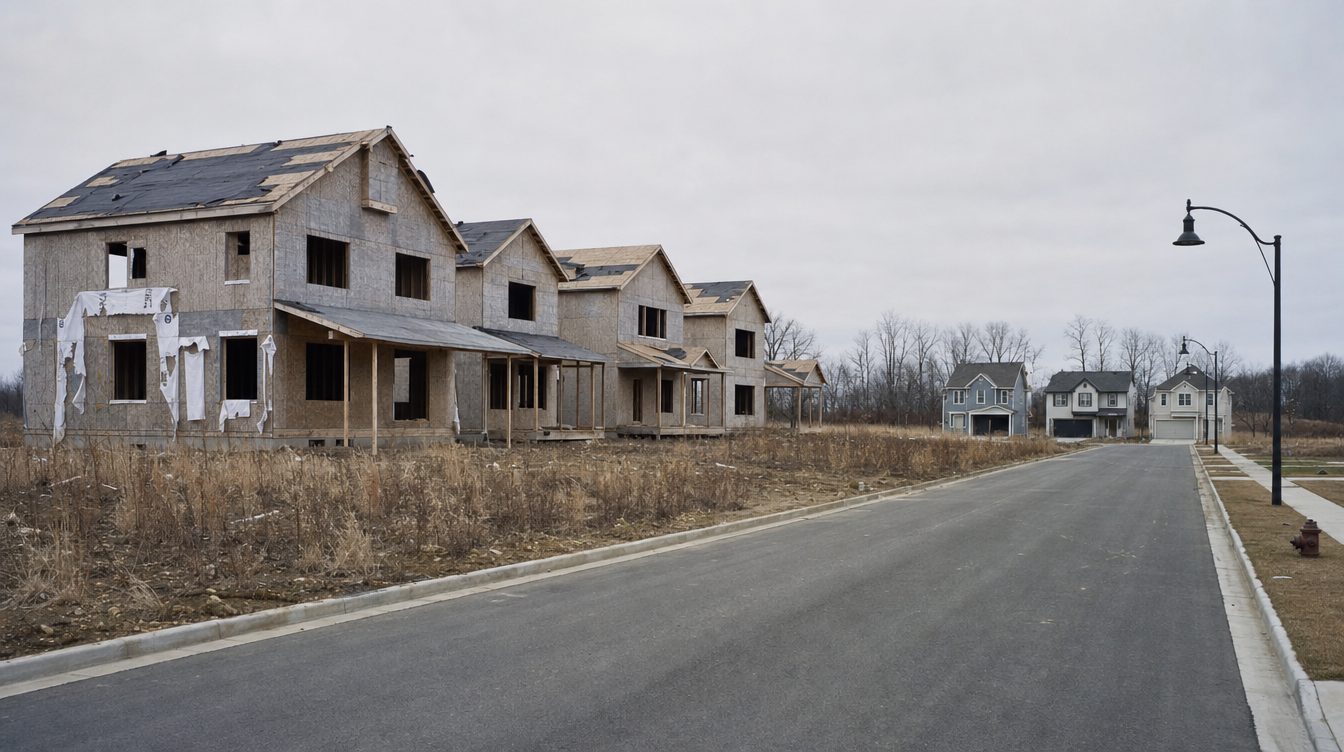
The outer counties fell hardest. One in five Prince William mortgages in 2005 came from a subprime lender, and Prince William and Loudoun were each permitting more than 5,000 new houses a year.
Arlington barely moved. It had the least subprime lending and permitted only 184 single-family homes in 2004. It could not overbuild.
Today those loans are gone. Since 2014, federal ability-to-repay rules make lenders check income and qualify buyers at the loan's full payment, so the no-documentation loans of 2005 have disappeared. Single-family building is down by more than 85% in both counties.
A 42-point spread inside one region. "Northern Virginia" never moves as one market.
Florida and Texas
The price drops you see in the news are real, in the places that built the most: Austin, Florida's Gulf Coast, Phoenix, Denver and Dallas. Two numbers from one Census Bureau file show the difference.
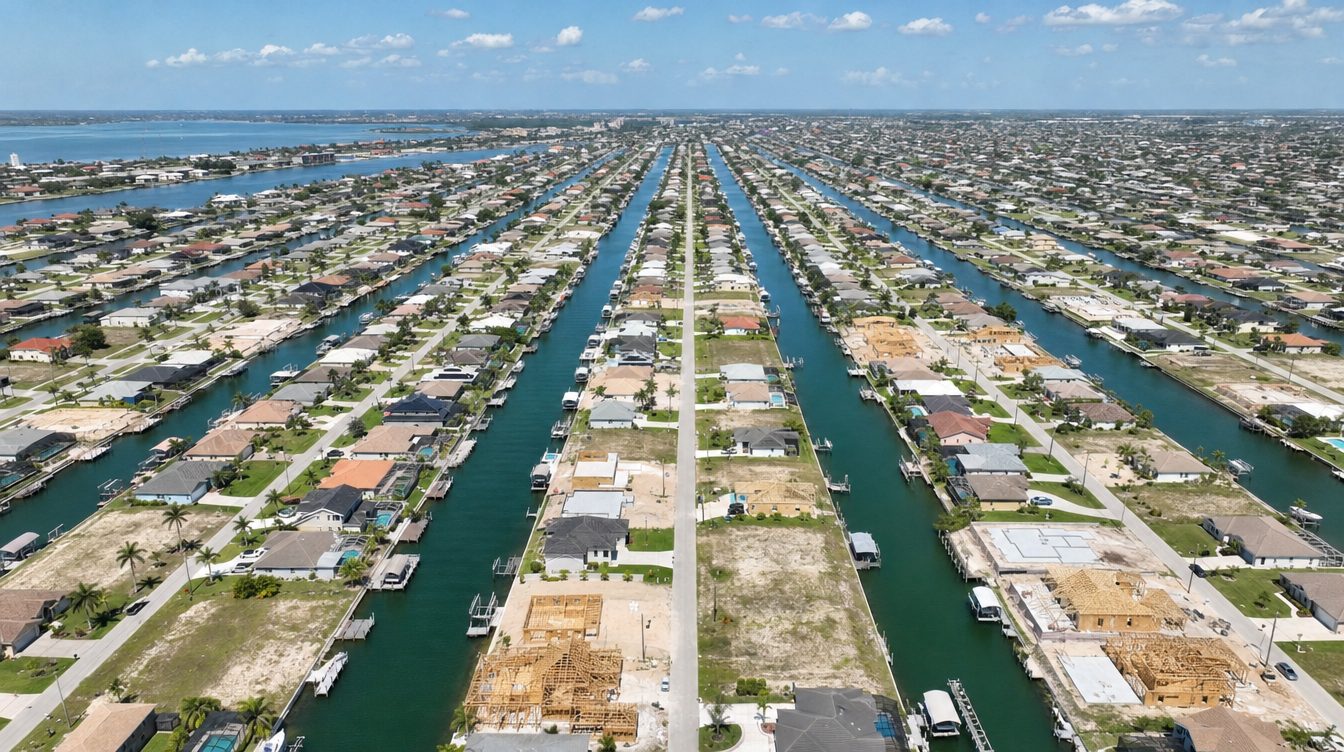
A region one-seventh our size built almost as many houses. Per person, that is 7.2 times as much building.3
The ten large metros furthest below their 2022 peak, on Zillow's home value index. The Washington metro is 4.2% above its 2022 peak.
Florida's Gulf Coast
Prices jumped in the pandemic, then a wave of new homes, rising insurance premiums and investors selling pushed values down. Cape Coral, Punta Gorda and Sarasota are 17% to 25% below their 2022 peak.14,17
Texas
New-home supply outran demand. Of the 50 largest metros, only five had falling prices in August 2026 on Redfin's index, and four were in Texas, with more than twice as many sellers as buyers.15
Why owners stay put
An owner paying 3% has every reason to keep the house and the loan. That keeps the number of homes for sale low, and a short supply holds prices up.

Each row includes the rows above it: 53.5% of Virginia mortgages carry a rate under 4%, and 79.9% are under 6%.
No reset wave is coming. In 2008, adjustable loans jumped to higher payments and owners could not pay. Today 96.9% of Virginia mortgages are fixed: the payment stays the same for the life of the loan.7
The distress check
Foreclosures are how a crash spreads: the bank sells at any price, and that sale becomes the comparable for the street. In Northern Virginia, late payments are at or below where they were in 2019.
The newest county figures are for September 2025, the latest the federal data covers by county.
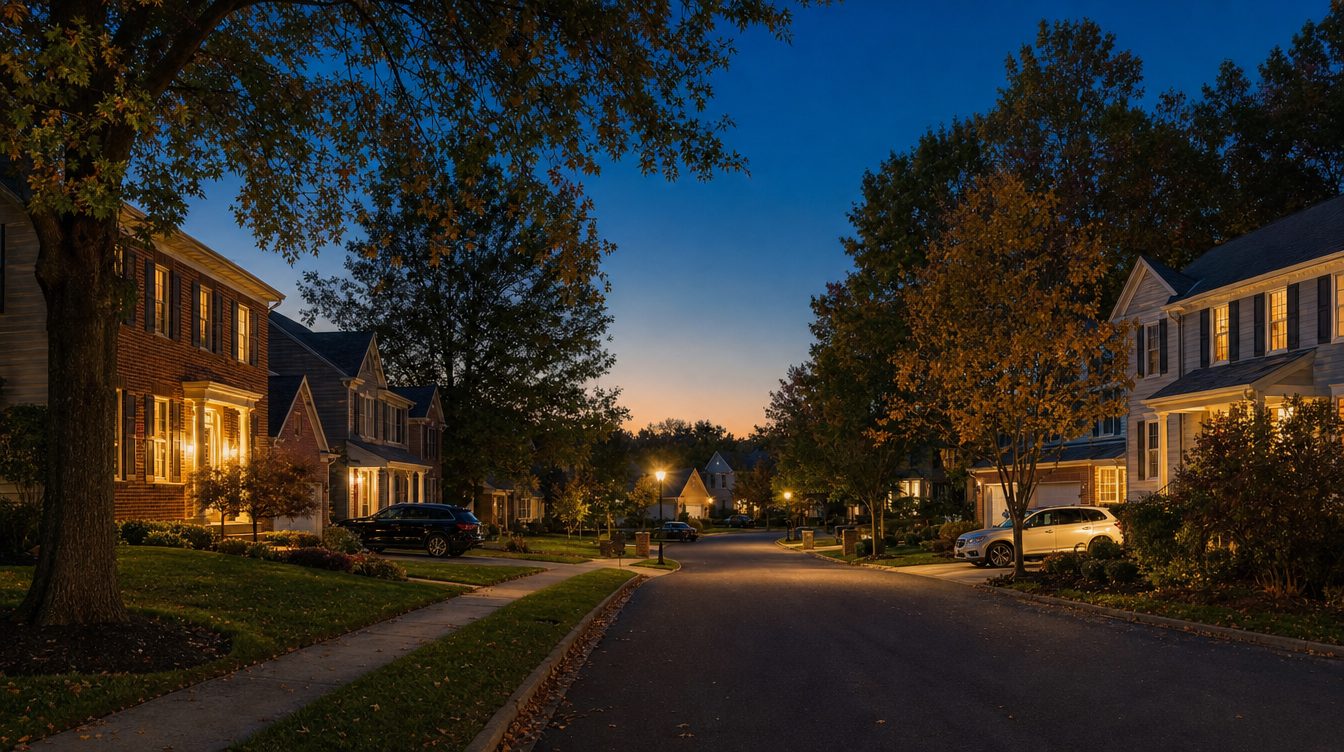
Underwater homes are rare. 2.9% of mortgaged Virginia homes owed seriously more than they were worth in the second quarter of 2026, against 3.2% nationally. It was 2.4% the quarter before, so it is edging up.13
Foreclosures stay below the national rate. In August 2026, 1 in every 5,006 Virginia homes had a foreclosure filing, against 1 in 3,569 nationally.13
Months of supply
Months of supply is how long the homes for sale today would last at the current pace of sales. A low number means buyers compete for few homes; a high number means sellers compete for few buyers. Northern Virginia is at about two to three months, well under the national 4.9, and rising from a year ago, so buyers have more choice than they did.
Fairfax, Arlington and Alexandria area
up 14.7% from a year earlier. Northern Virginia Association of REALTORS, August 2026.8
Prince William, Manassas and Manassas Park
1.8 a year earlier. Prince William Association of REALTORS, August 2026.10
Each association counts its own area, so the Loudoun figure from the Dulles Area Association (1.9) differs slightly from the Northern Virginia Association's count for Loudoun (2.09). All figures cover houses, townhouses and condos together.
What forecasters expect
The forecasts sit in a thin sliver around zero. The bottom bar is what a real crash looked like here, drawn on the same scale.
What counts as a crash?
Prices flat or easing, more homes for sale, sales slower. Where 2026 is now.
A normal dip. Possible in condos or at the top of the market if rates climb further.
2008 in Prince William and Loudoun. It took subprime loans, thousands of new homes a year and a wave of foreclosures.
Latest values, August 2026: Zillow's home value index puts Fairfax at $760,599 (+0.8% from a year earlier), Loudoun at $795,391 (+1.4%) and Prince William at $581,036 (+1.1%).11
The honest part
No crash does not mean no risk. These are the numbers to watch.
Condo listings in the NVAR area are up 44.8% from a year ago, and Fairfax condos are forecast at −0.2% for 2026. This is where prices can slip.8
The rate on a new loan was 7.28% in the week of October 1, 2026, up from 6.34% a year earlier. High rates slow sales and squeeze budgets.1
Active listings in the NVAR area are up 18.5% and closed sales down 8.0% from August 2025, and across the Washington metro one listing in five has had a price cut. Good for buyers; sellers need sharp pricing.8,16
The county late-payment figures run through September 2025. Anything that changed after that is not yet in the federal data.6
Virginia's seriously underwater share rose from 2.4% to 2.9% in one quarter. Still below the nation, but moving the wrong way.13
Prince William's peak price came back in 2021, but in 2021 dollars. Getting the price back is not the same as making money after inflation.
Waiting for a 30% drop? The data does not support it. What has changed is choice: more homes for sale and more room to negotiate. Tell me your budget and the area, and I will show you what that means for you.
Ask AhmedQuestions
Nothing in the data points to a 2008-style crash. A crash needs risky loans, too many new homes and forced sellers. Today 96.9% of Virginia mortgages are fixed rate (FHFA, first quarter of 2026), only 0.2% to 0.7% of Fairfax, Loudoun and Prince William mortgages were 90 or more days late in September 2025 (CFPB), and Prince William permitted 726 single-family homes in 2025 against 5,307 in 2004 (US Census Bureau). Forecasters expect prices from about −0.2% to +4.2% in 2026.
Yes. On the Zillow Home Value Index, Prince William County fell 43.4% from July 2006 to September 2009, Loudoun 34.5%, Fairfax 26.2% and Arlington 12.2%. The deepest drops were in the counties with the most subprime lending and the most new building.
No. In 2025 Cape Coral–Fort Myers, with 876,000 people, permitted 9,962 single-family homes; the whole Washington metro, with 6.47 million, permitted 10,168 (US Census Bureau). Places that overbuilt are well below their 2022 peak values: Austin −27.6% and Cape Coral −19.3% in August 2026 (Zillow), while the Washington metro was 4.2% above its 2022 peak.
Months of supply is how long the homes for sale would last if no new listings came and sales kept their current pace. In August 2026 it was 1.9 months in Loudoun (Dulles Area Association of REALTORS), 2.08 in the Fairfax, Arlington and Alexandria area (NVAR) and 2.8 in Prince William (PWAR), against 4.9 for the United States. It is rising from a year ago, so buyers have more choice than they did.
Condos. Condo listings in the NVAR area were up 44.8% in August 2026 from a year earlier, and the NVAR and George Mason University forecast has Fairfax condos at −0.2% for 2026, while single-family homes are forecast to rise.
Waiting for a 20% to 30% drop is a bet against the data above. What has changed is choice: listings are up and homes take longer to sell than a year ago, which gives buyers more room to negotiate. The right timing depends on your rate, your budget and how long you will stay.
Your next step
Send your situation and get real numbers back, in English or Arabic, not a pitch.
دليل شمال فرجينيا · سوق العقار
لا تشير البيانات إلى انهيار شبيه بما حدث في عام 2008. فقد انهارت الأسعار آنذاك بسبب القروض عالية المخاطر وكثرة البيوت الجديدة، ما أدى إلى موجة من البيع القسري. أما اليوم، فإن 96.9% من قروض الرهن العقاري في فرجينيا بفائدة ثابتة (الربع الأول من 2026)، ولم تتجاوز نسبة القروض المتأخرة عن السداد 90 يومًا أو أكثر 0.7% في مقاطعات فيرفاكس ولاودن وبرنس وليام (سبتمبر 2025). كما انخفض عدد تصاريح بناء البيوت المستقلة في مقاطعة برنس وليام من 5,307 في عام 2004 إلى 726 في عام 2025.
ولا يتحرك سوق شمال فرجينيا كتلة واحدة: فأسعار البيوت المستقلة في لاودن مرشحة للارتفاع، والسوق في فيرفاكس مستقر، أما الشقق السكنية (الكوندو) فهي الأضعف، إذ ارتفع عدد المعروض منها بنسبة 44.8% مقارنة بالعام الماضي (أغسطس 2026).
وكيلك العقاري الموثوق في شمال فرجينيا.
Keep exploring
20 places compared.
Open the guide County guide15 places compared.
Open the guide County guideEvery town compared.
Open the guide County guideBy zip code.
Open the guide Buying powerTax, insurance and HOA included.
Open the calculator DataFifty-one years of prices.
See the history